English繁體中文
Spatial analysis · Interactive demonstrations

Explore data, Understand places.

Project demonstrations

Open each project to explore its map, methods, and findings. These demonstrations use open data or explicitly simulated inputs.

Illustration of agricultural fields
SIMULATED INTERACTIVE PROTOTYPE

Farm Environmental Monitoring

Explore a simulated timeline across five field plots. The prototype highlights cold stress, water shortage, and waterlogging, and explains a proposed AI-agent and RAG workflow. Readings and recommendations are simulated; the demo does not run a live LLM.

LeafletGeoJSONMonitoringWorkflow design
Open interactive prototype →
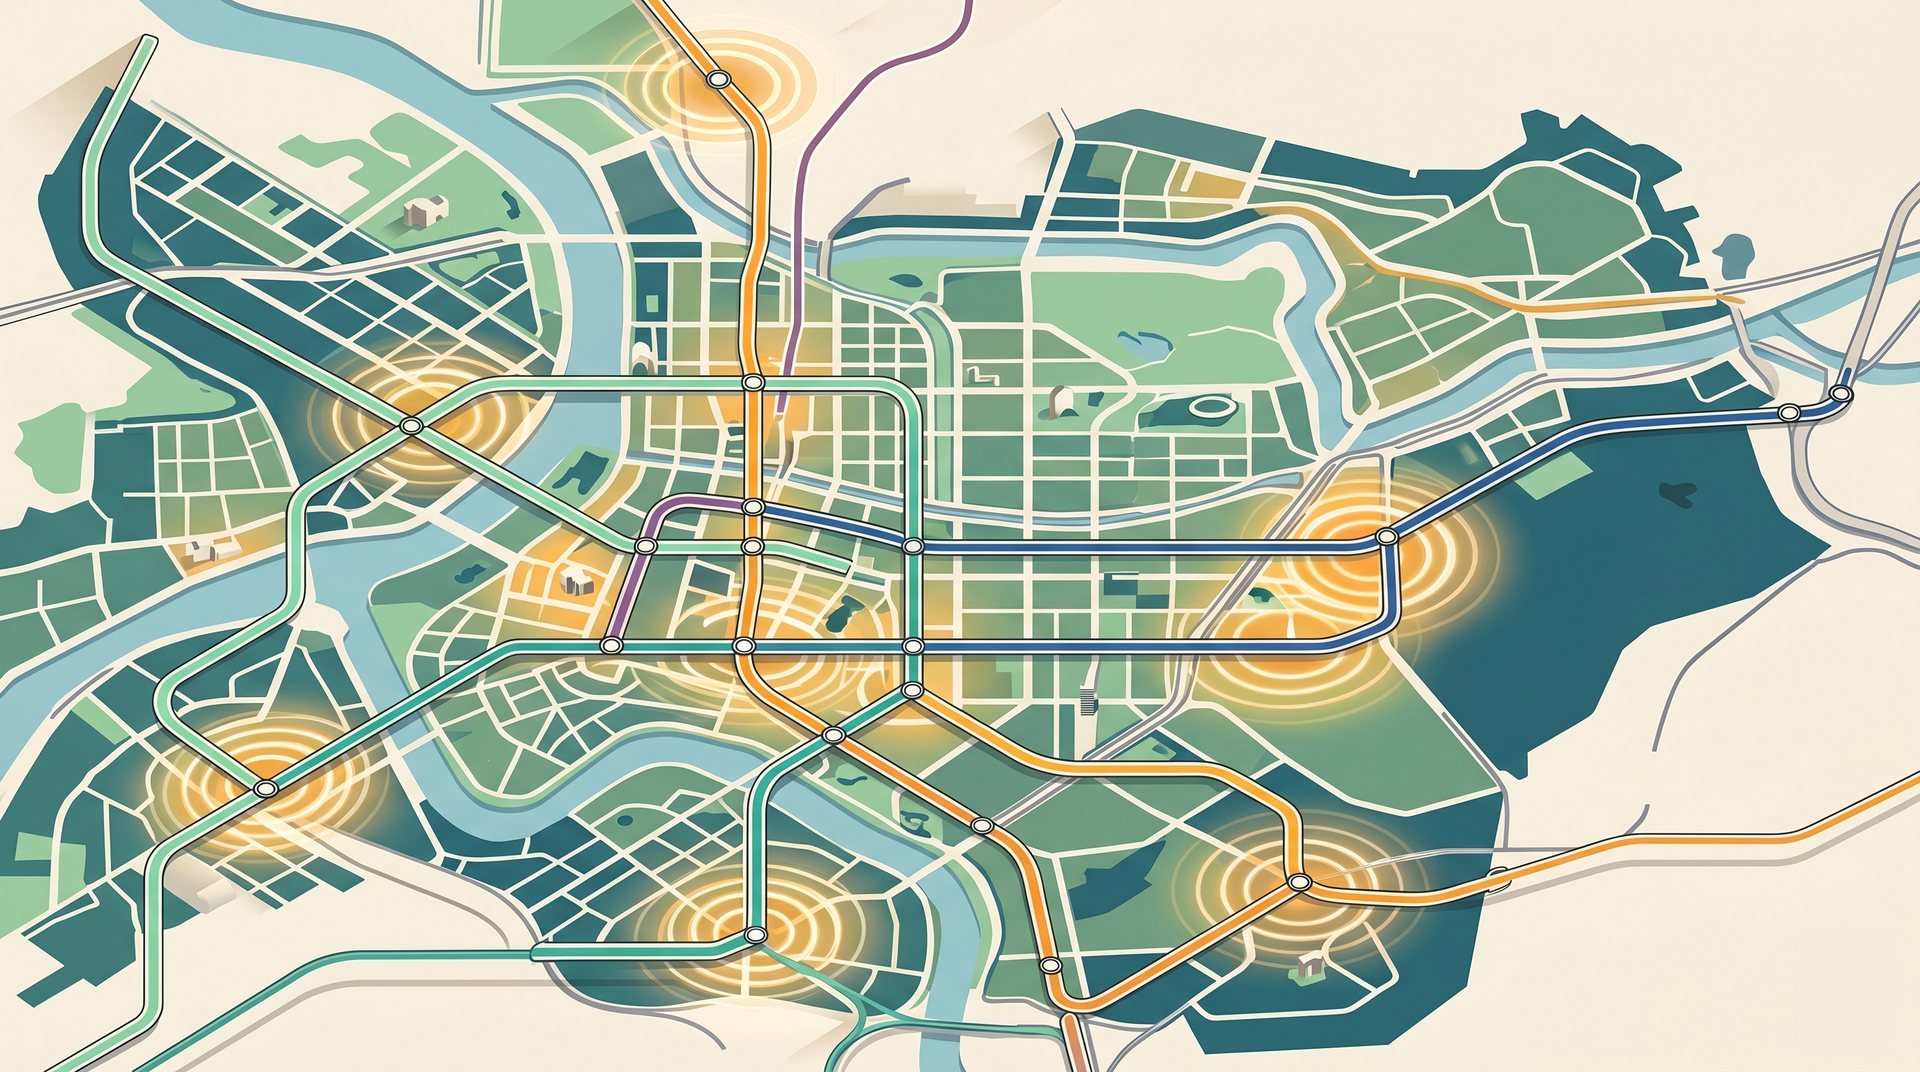
Illustration of rail transit and housing-price patterns
OPEN-DATA ANALYSIS

Taipei Housing Market Map

Explore recorded housing prices through four map modes: districts, individual projects, heat patterns, and station catchments. The analysis aggregates 5,475 presale records into 256 projects and compares locations around 87 Taipei MRT stations using 2025–2026 first-half registration batches.

PythonETLLeafletHousing data
Explore the market map →
Illustration of older buildings and urban redevelopment
OPEN-DATA ANALYSIS

Older-Building Demolition Risk

Compare redevelopment pressure across Taipei’s 12 districts. Five indicators combine building-age patterns, land prices, renewal activity, recent construction, and MRT accessibility. The analysis focuses on ordinary older buildings without designated heritage status.

GeoPandasFoliumRisk indicatorsUrban analysis
Explore the risk analysis →
Original Qingpu autonomous shuttle analysis overview
OPEN-DATA ANALYSIS

Qingpu Shuttle Feasibility

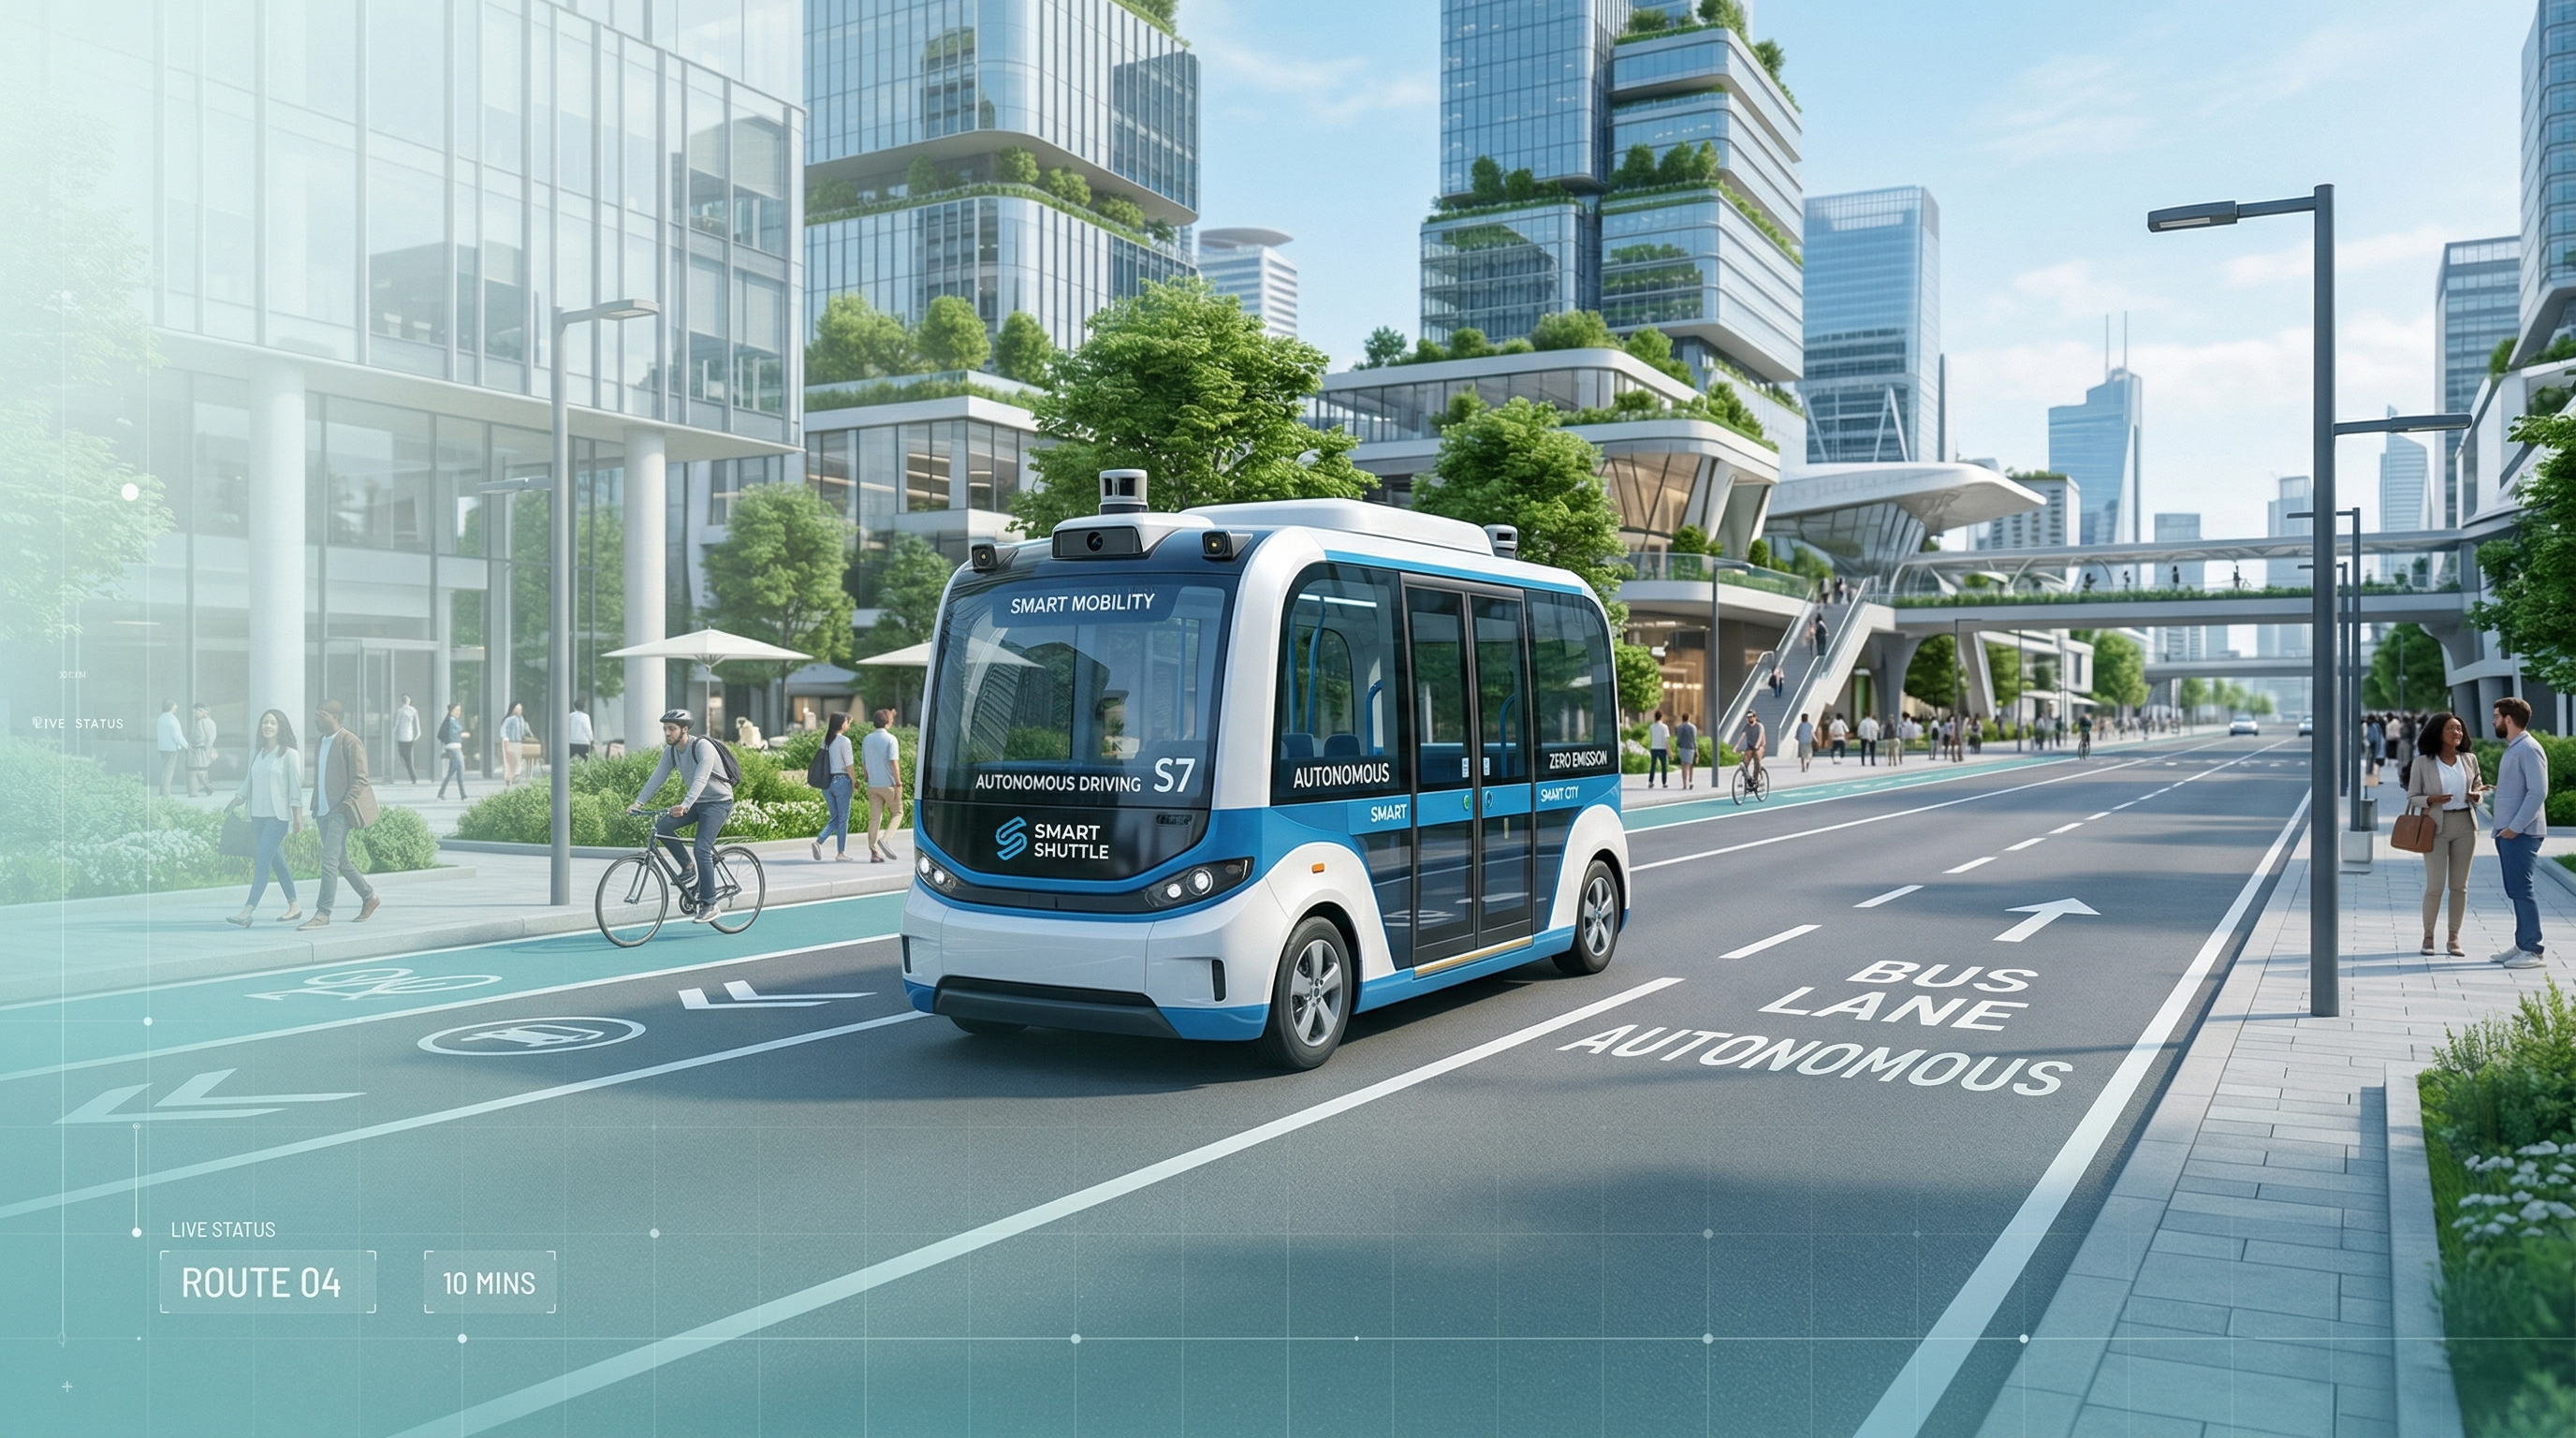
Explore a spatial planning study of autonomous shuttle service in Qingpu, Taoyuan. The study combines service gaps, road suitability, and demand locations to propose three routes. Under the study’s coverage assumptions, the service gap decreases from 22.1% to 15.1%.

QGISGeoPandasFoliumTransport planning
Explore the feasibility study →