A · Residential shuttle
3.35km · Taoyuan HSR Station
Connects gap #1 and northwestern residential communities, including Baolai Garden and Prague Spring, for homebound HSR commuters. Proposed phase 1.
GIS spatial analysis · ODD assessment · Demand-weighted stop placement
From identifying last-mile service gaps to designing three shuttle routes and a phased implementation strategy.
Qingpu combines planned urban development, major retail destinations and a multimodal transport hub. Taoyuan HSR Station and the Airport MRT connect regional journeys, while gaps in local bus access create a last-mile challenge. IKEA, Xpark, Gloria Outlets and Cathay Landmark generate trips alongside growing residential communities.
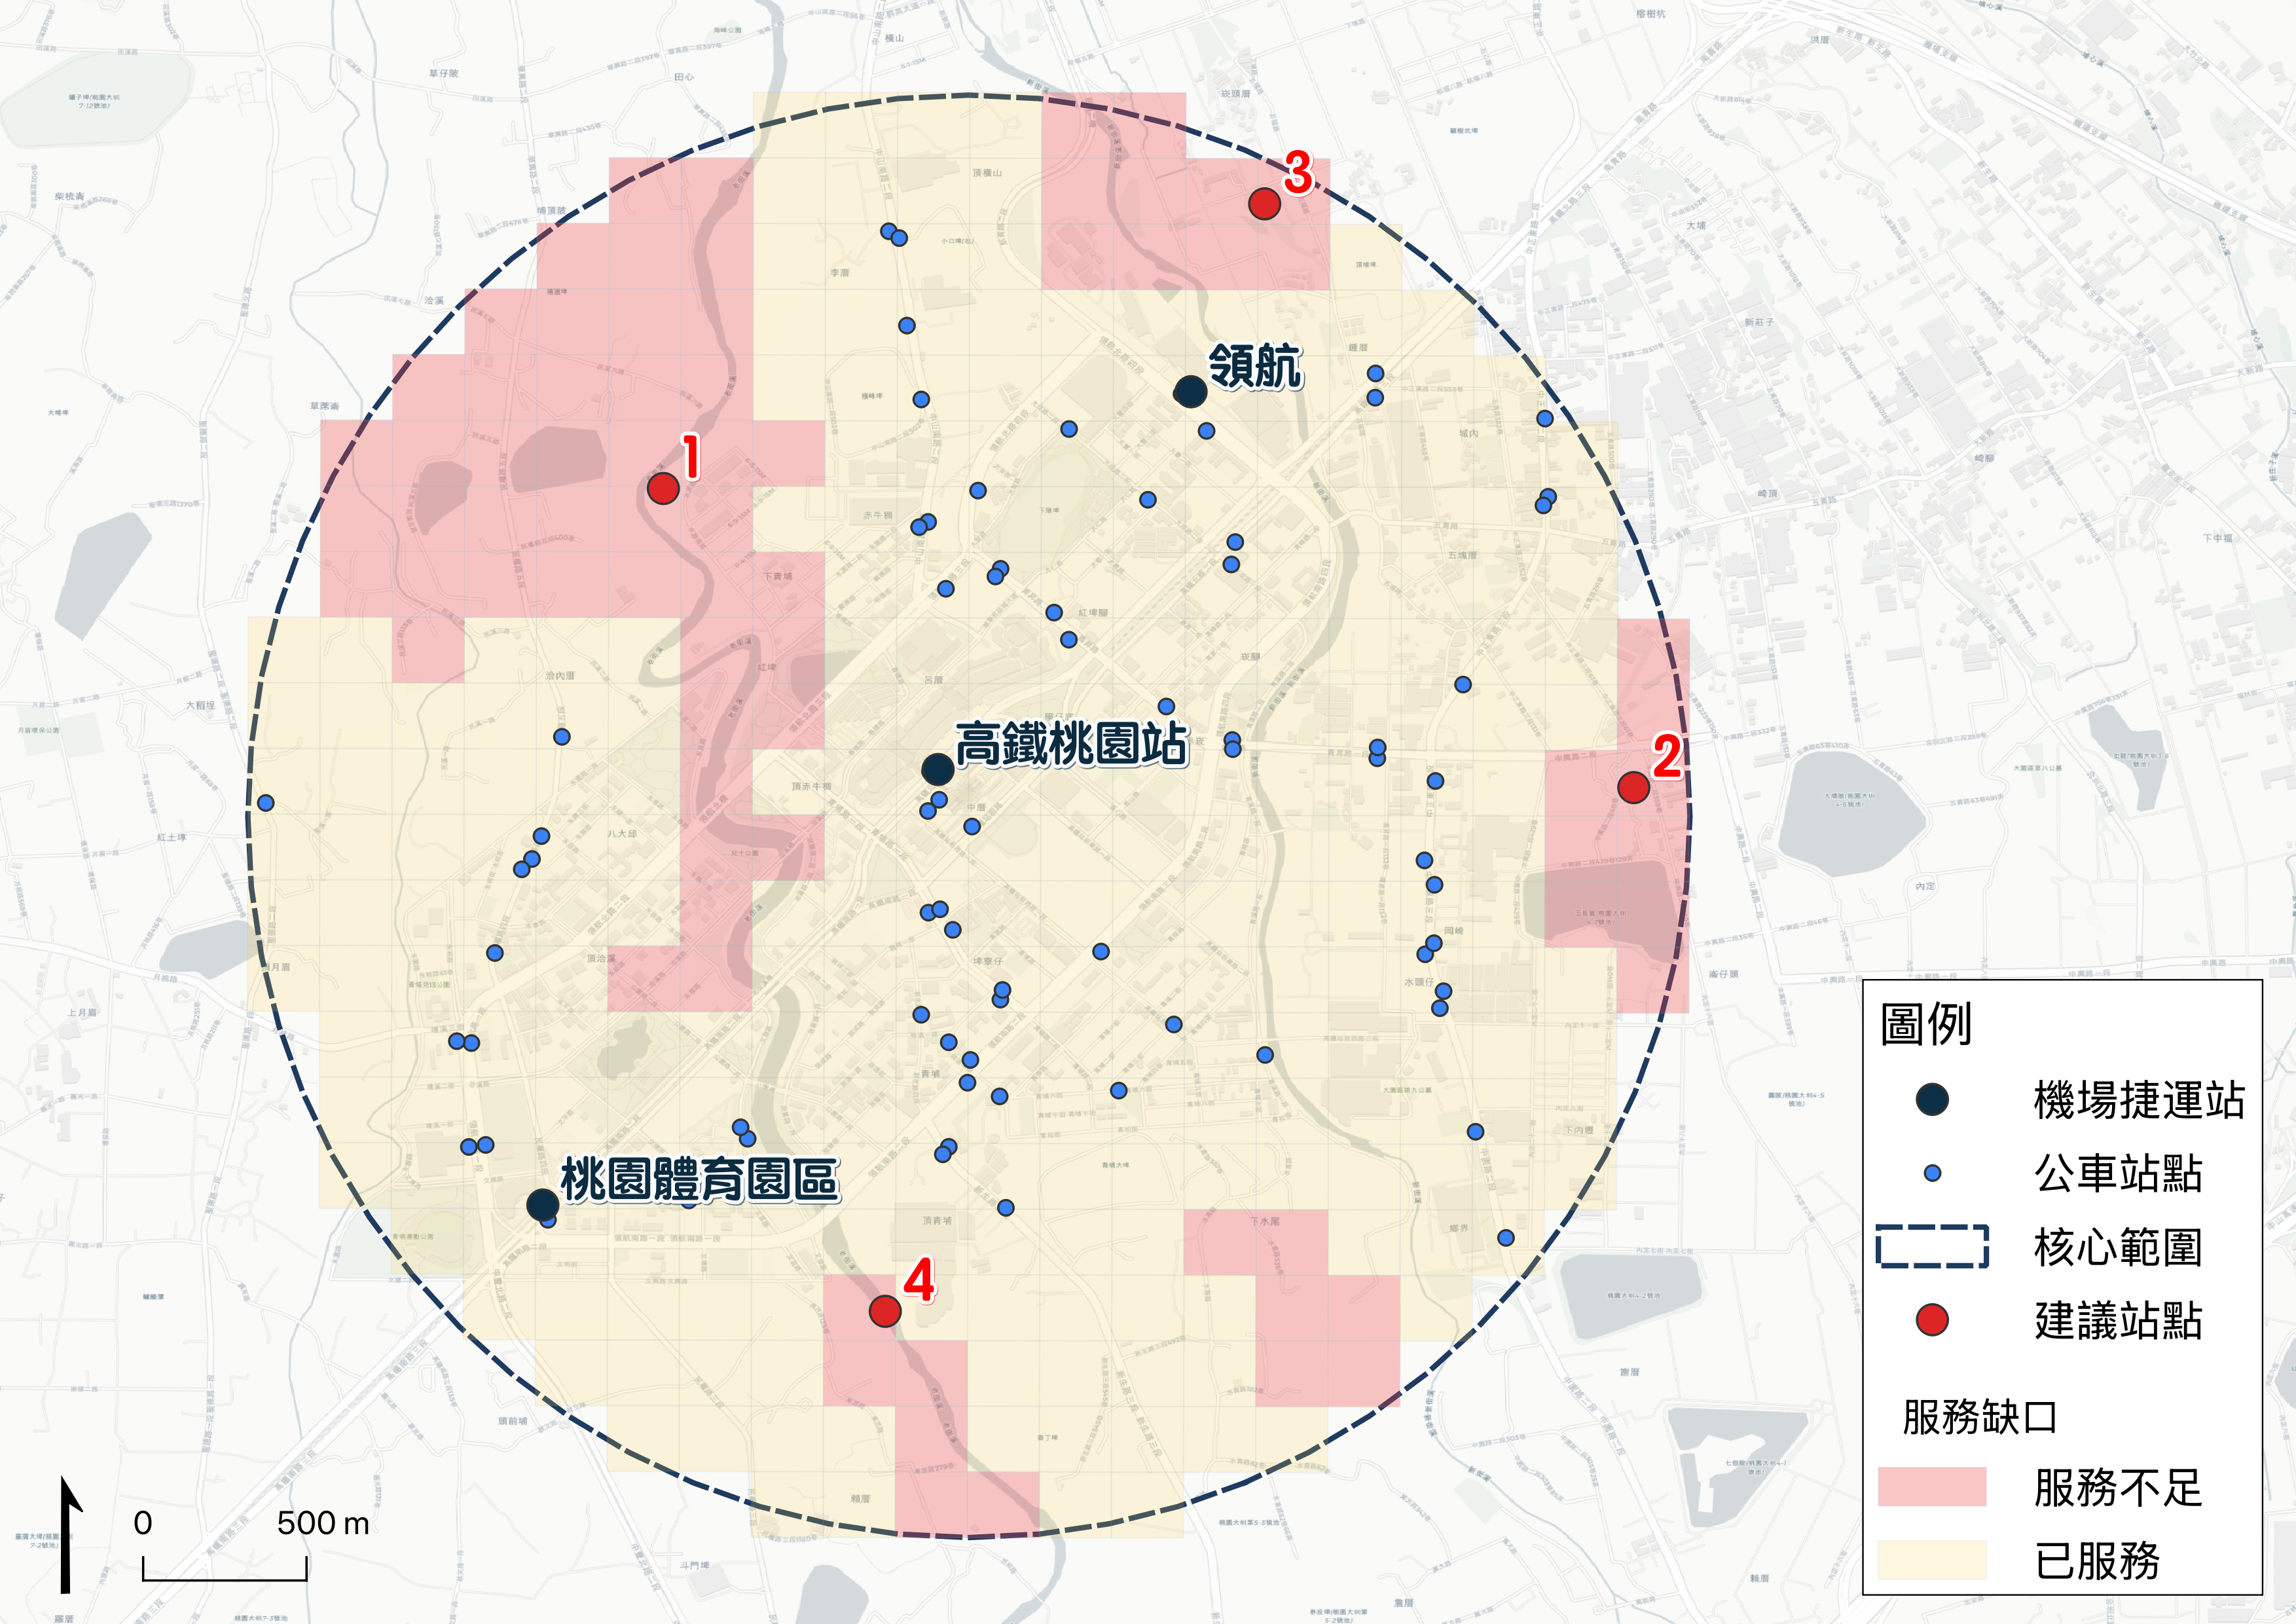
The report defines a circular study area with a 2km radius around Taoyuan HSR Station. It includes three rail stations and 74 bus stops. Buffers of 400m around those stops cover 77.9% of the area, leaving 22.1% more than 400m from the nearest stop.
This is an archived planning analysis, not a live transport service or an approved deployment. Figures below retain the original report snapshot. The interactive map retains its original map snapshot, which has some different counts and labels; the differences are explained below.
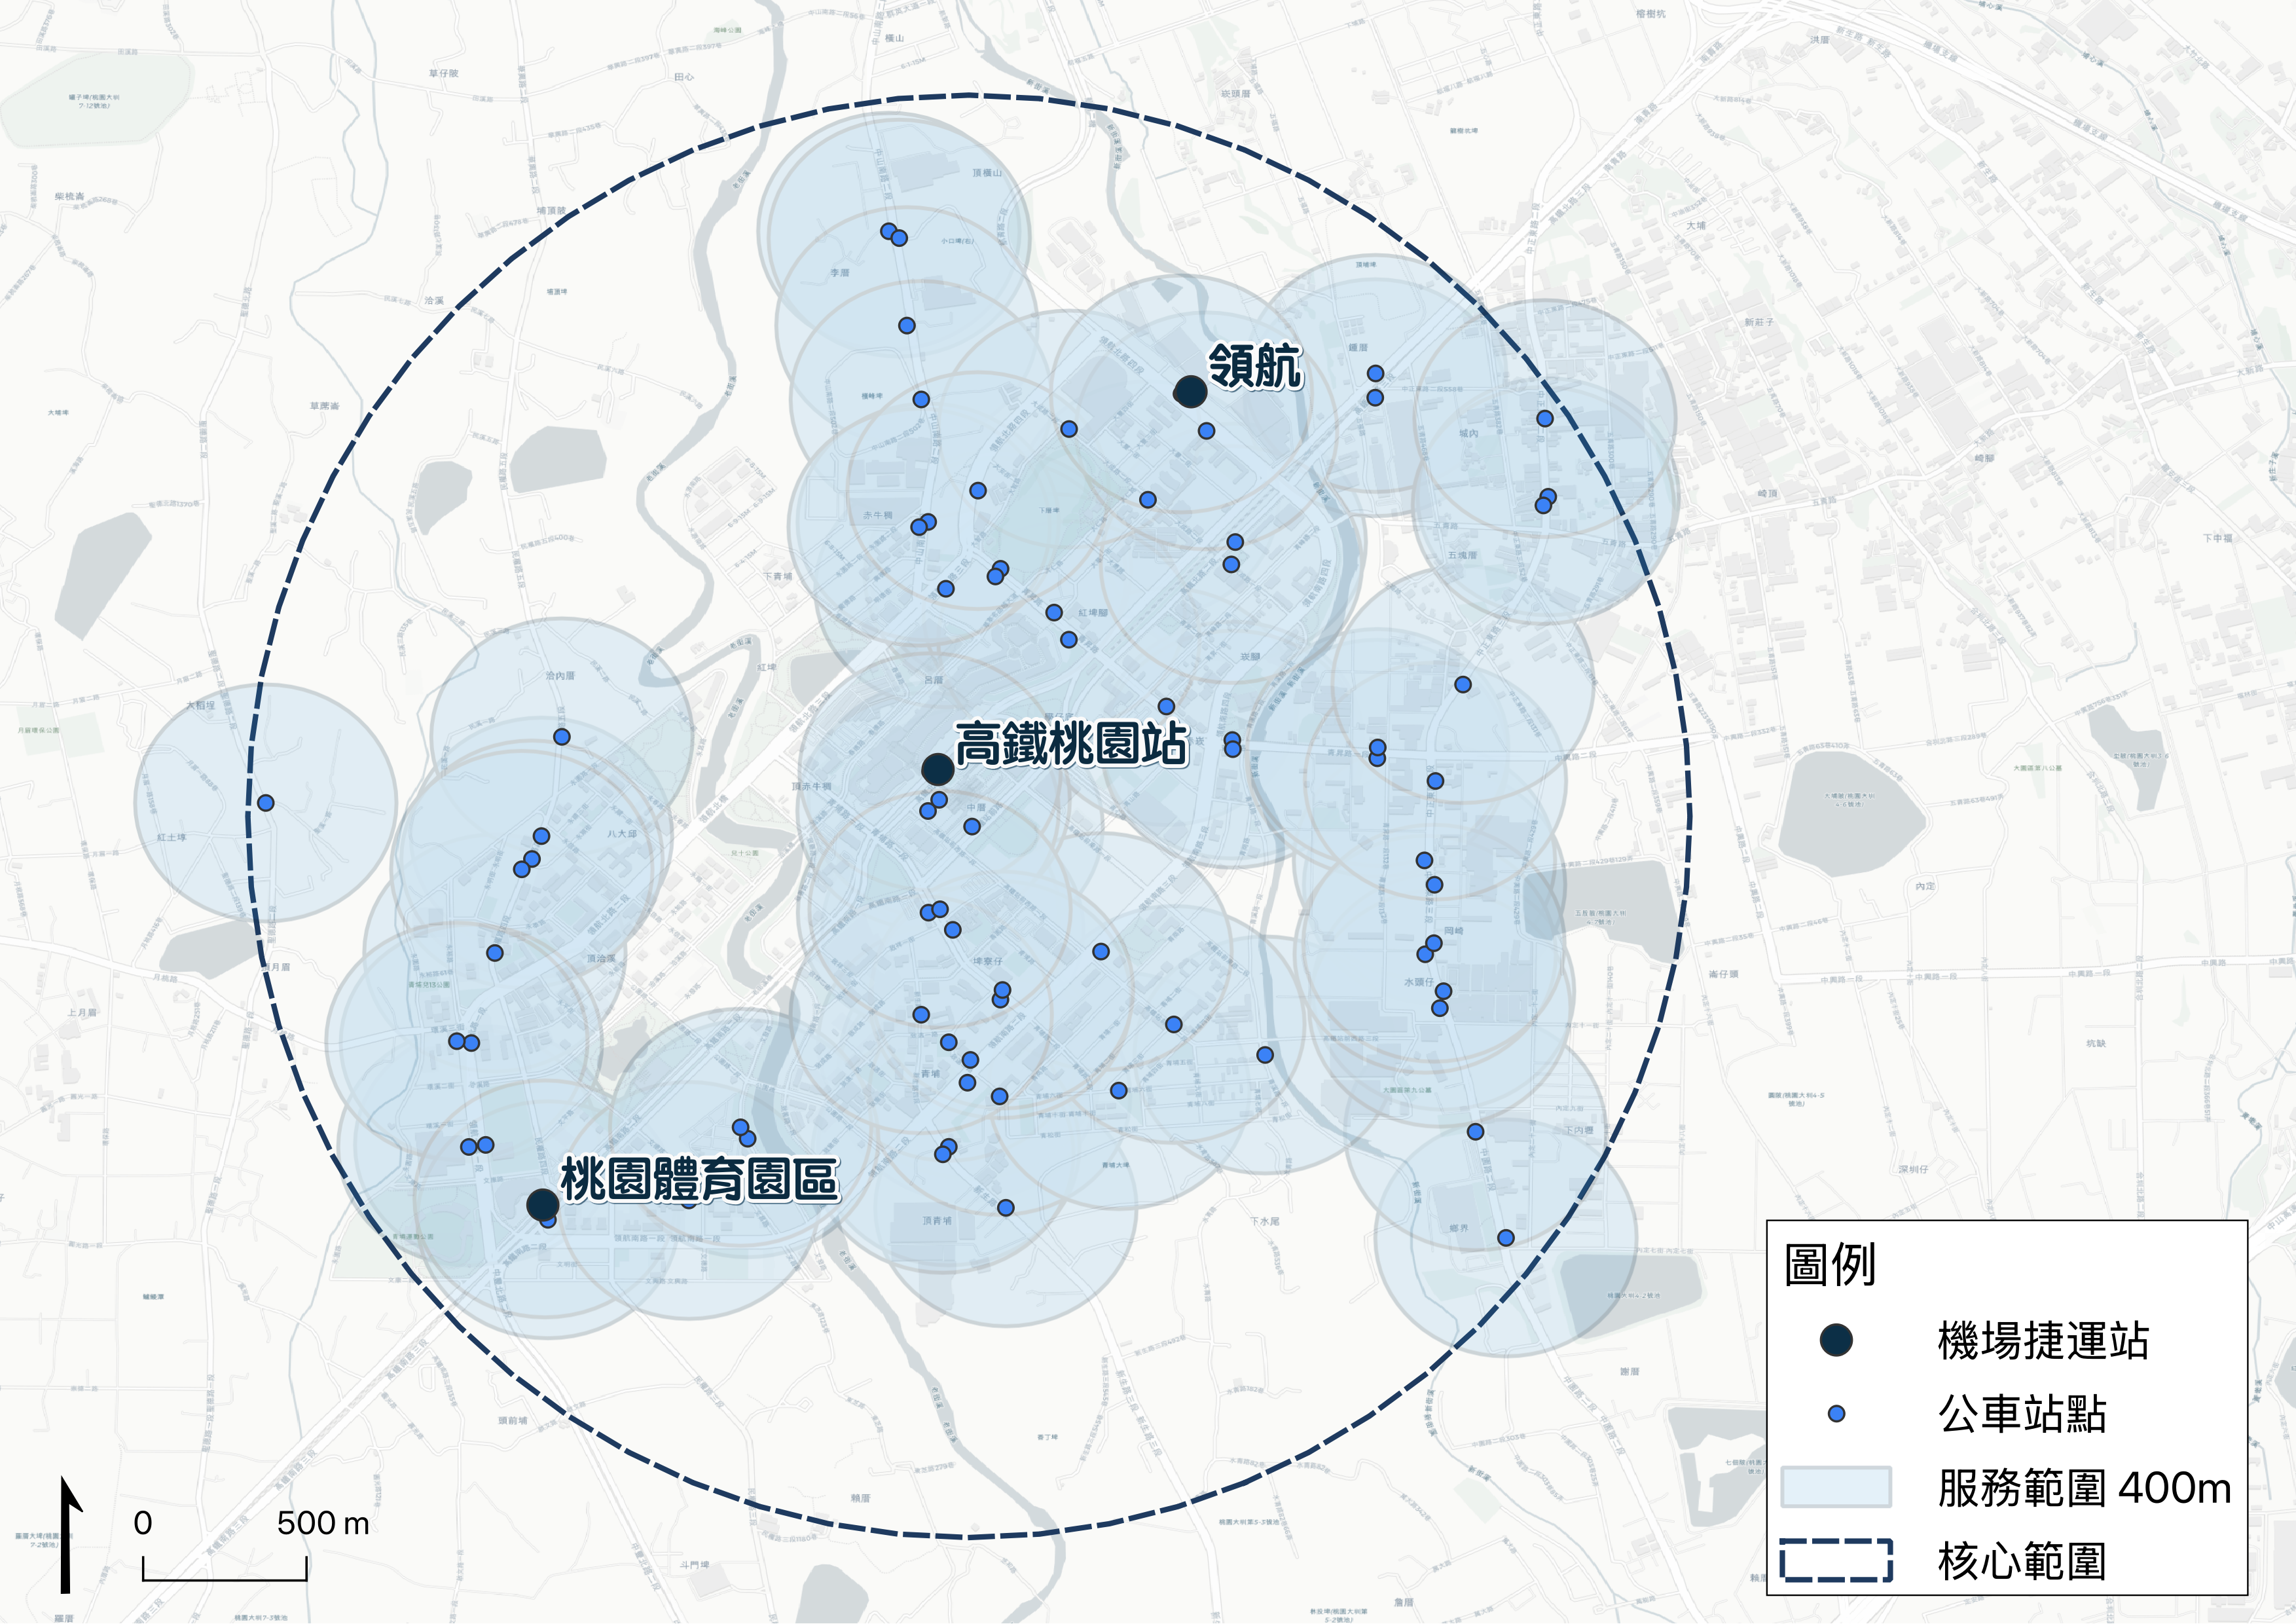
| Dataset | Source used in the report | Count |
|---|---|---|
| Bus stops | OpenStreetMap / Overpass API | 74 within the core |
| Road network | OpenStreetMap | 15,744 segments |
| Demand POIs | OpenStreetMap / Overpass API | 1,802 residential + employment |
| Village boundaries | OpenStreetMap (admin_level=9) | 13 villages |
| Airport MRT stations | OpenStreetMap | 3 stations |
The report adopts 400m for stop access. Its reference comparison lists the US FTA at 400m (¼ mile), UK CIHT at 400m, Japan's Ministry of Land, Infrastructure, Transport and Tourism at 300–500m, and Taiwan's Ministry of Transportation and Communications at 400m. These are historical study assumptions, rather than a claim that every cited document mandates the same threshold.
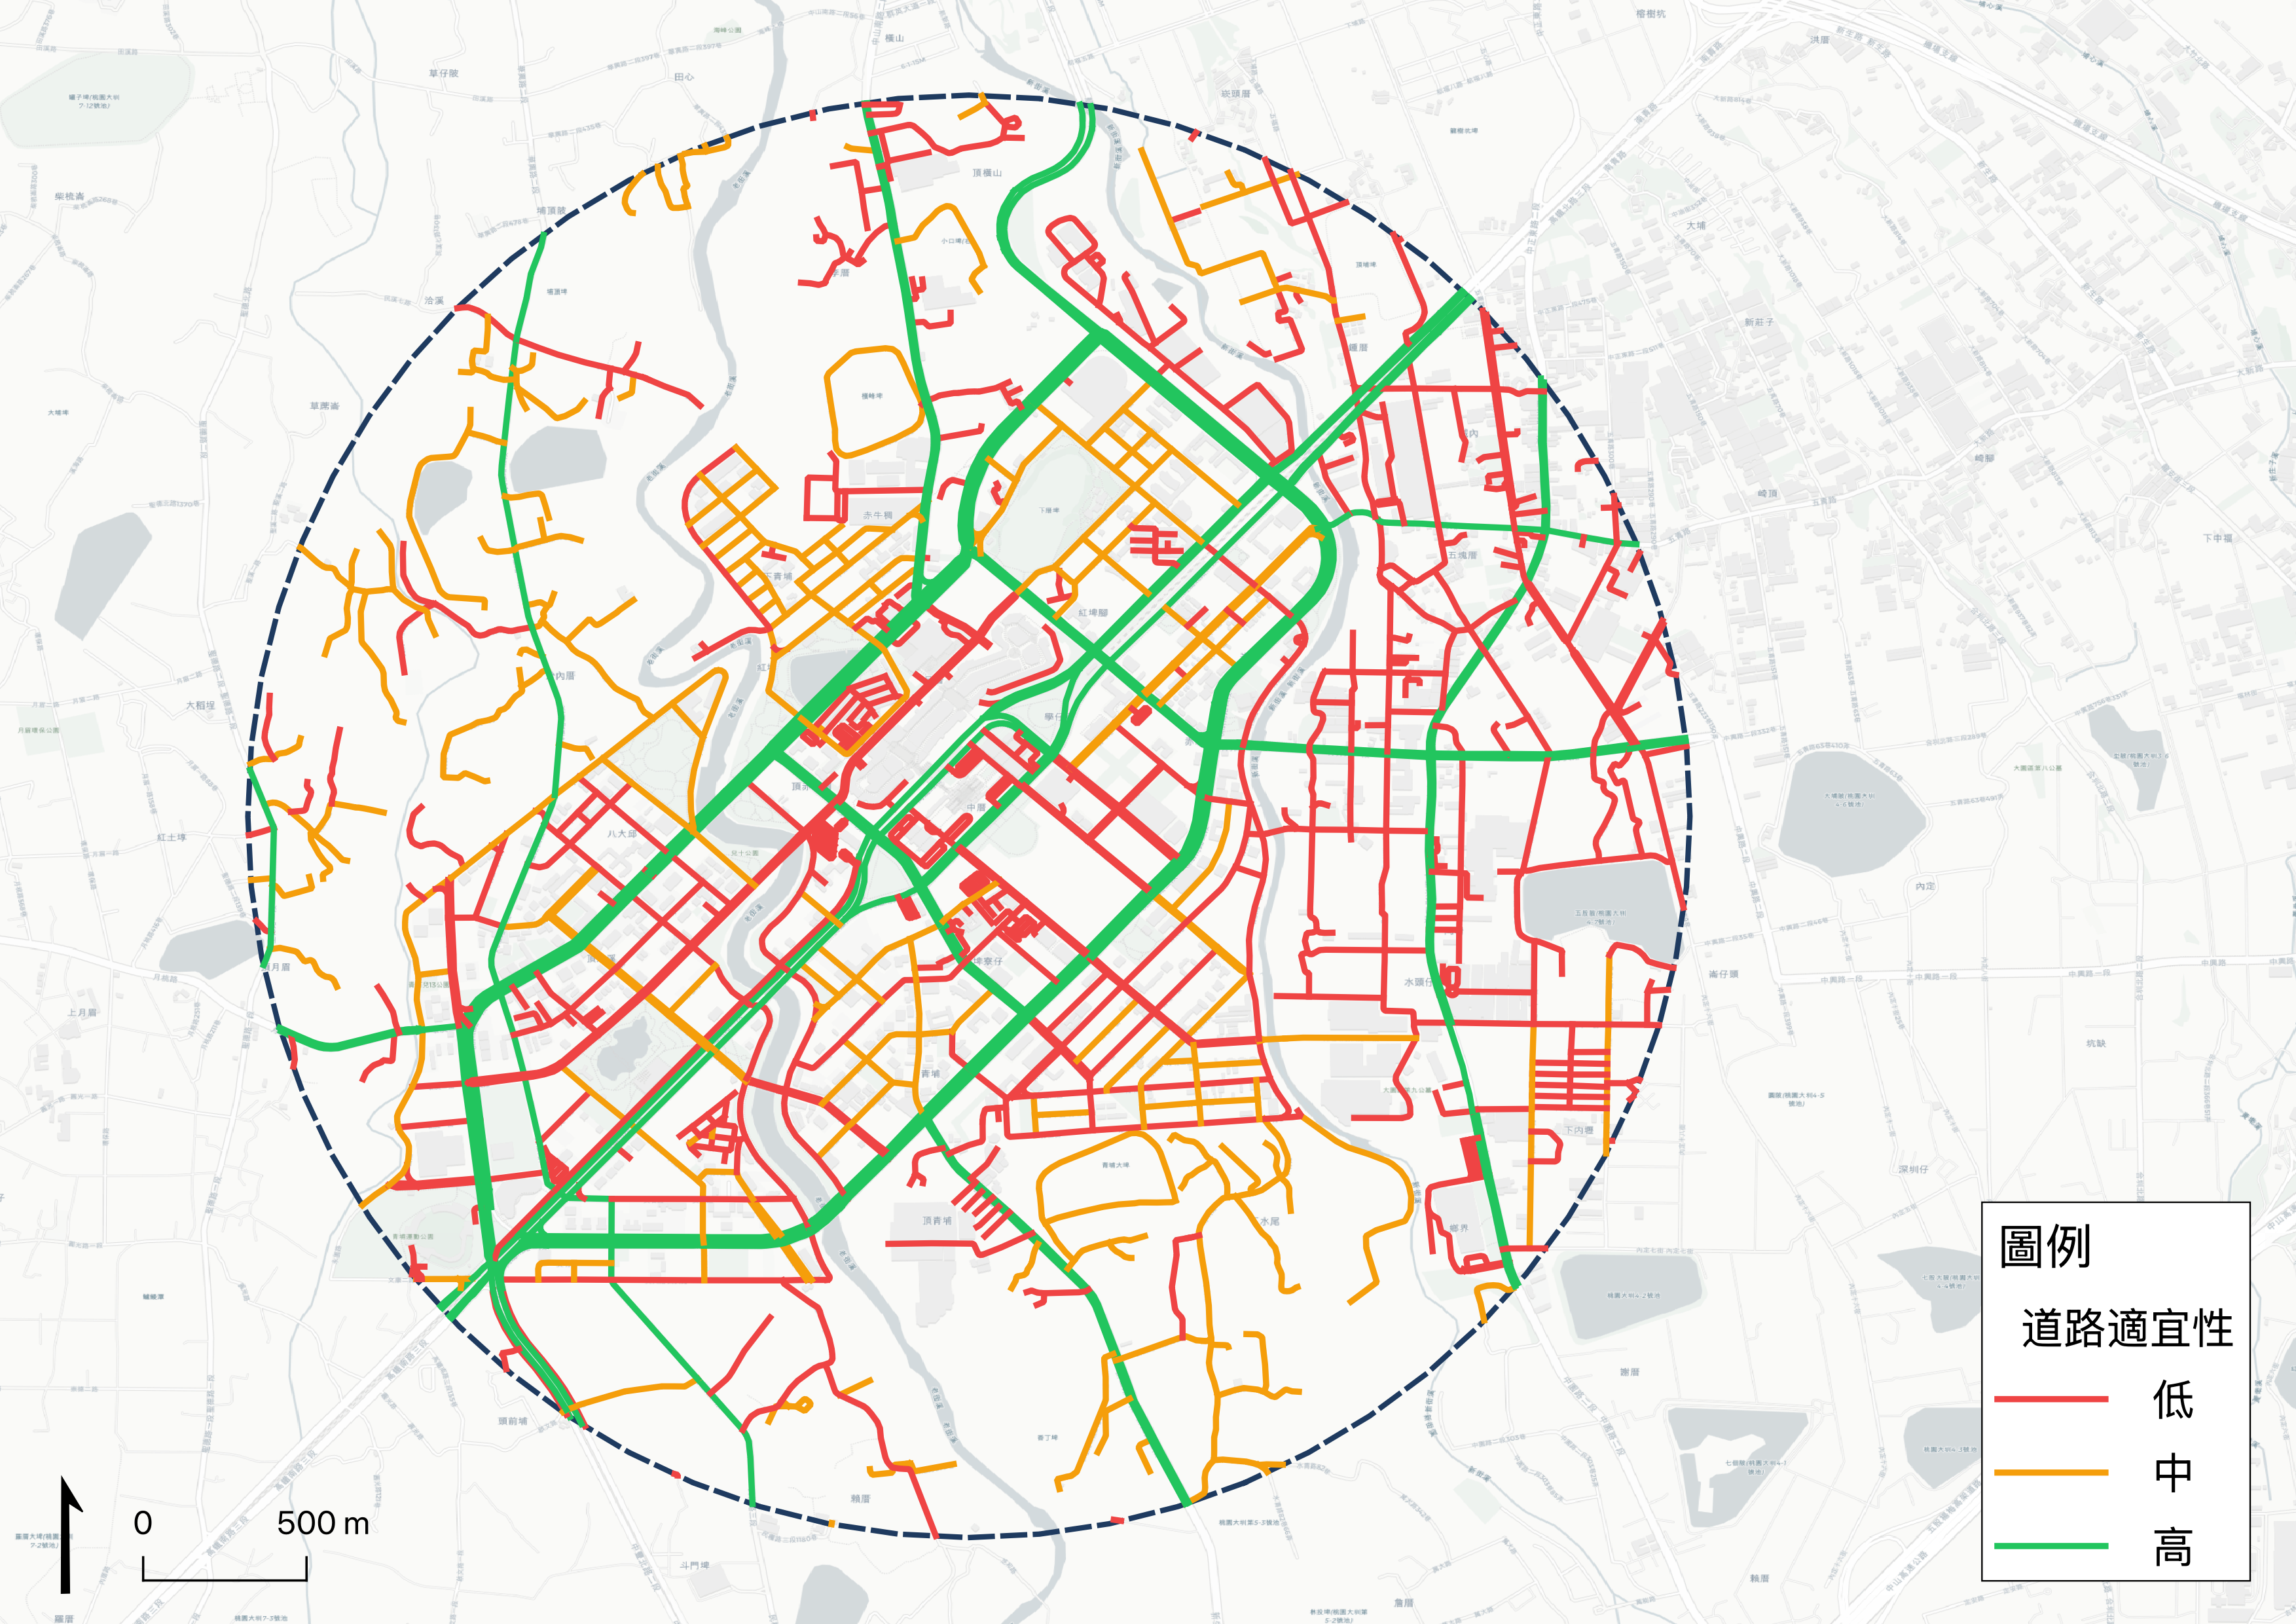
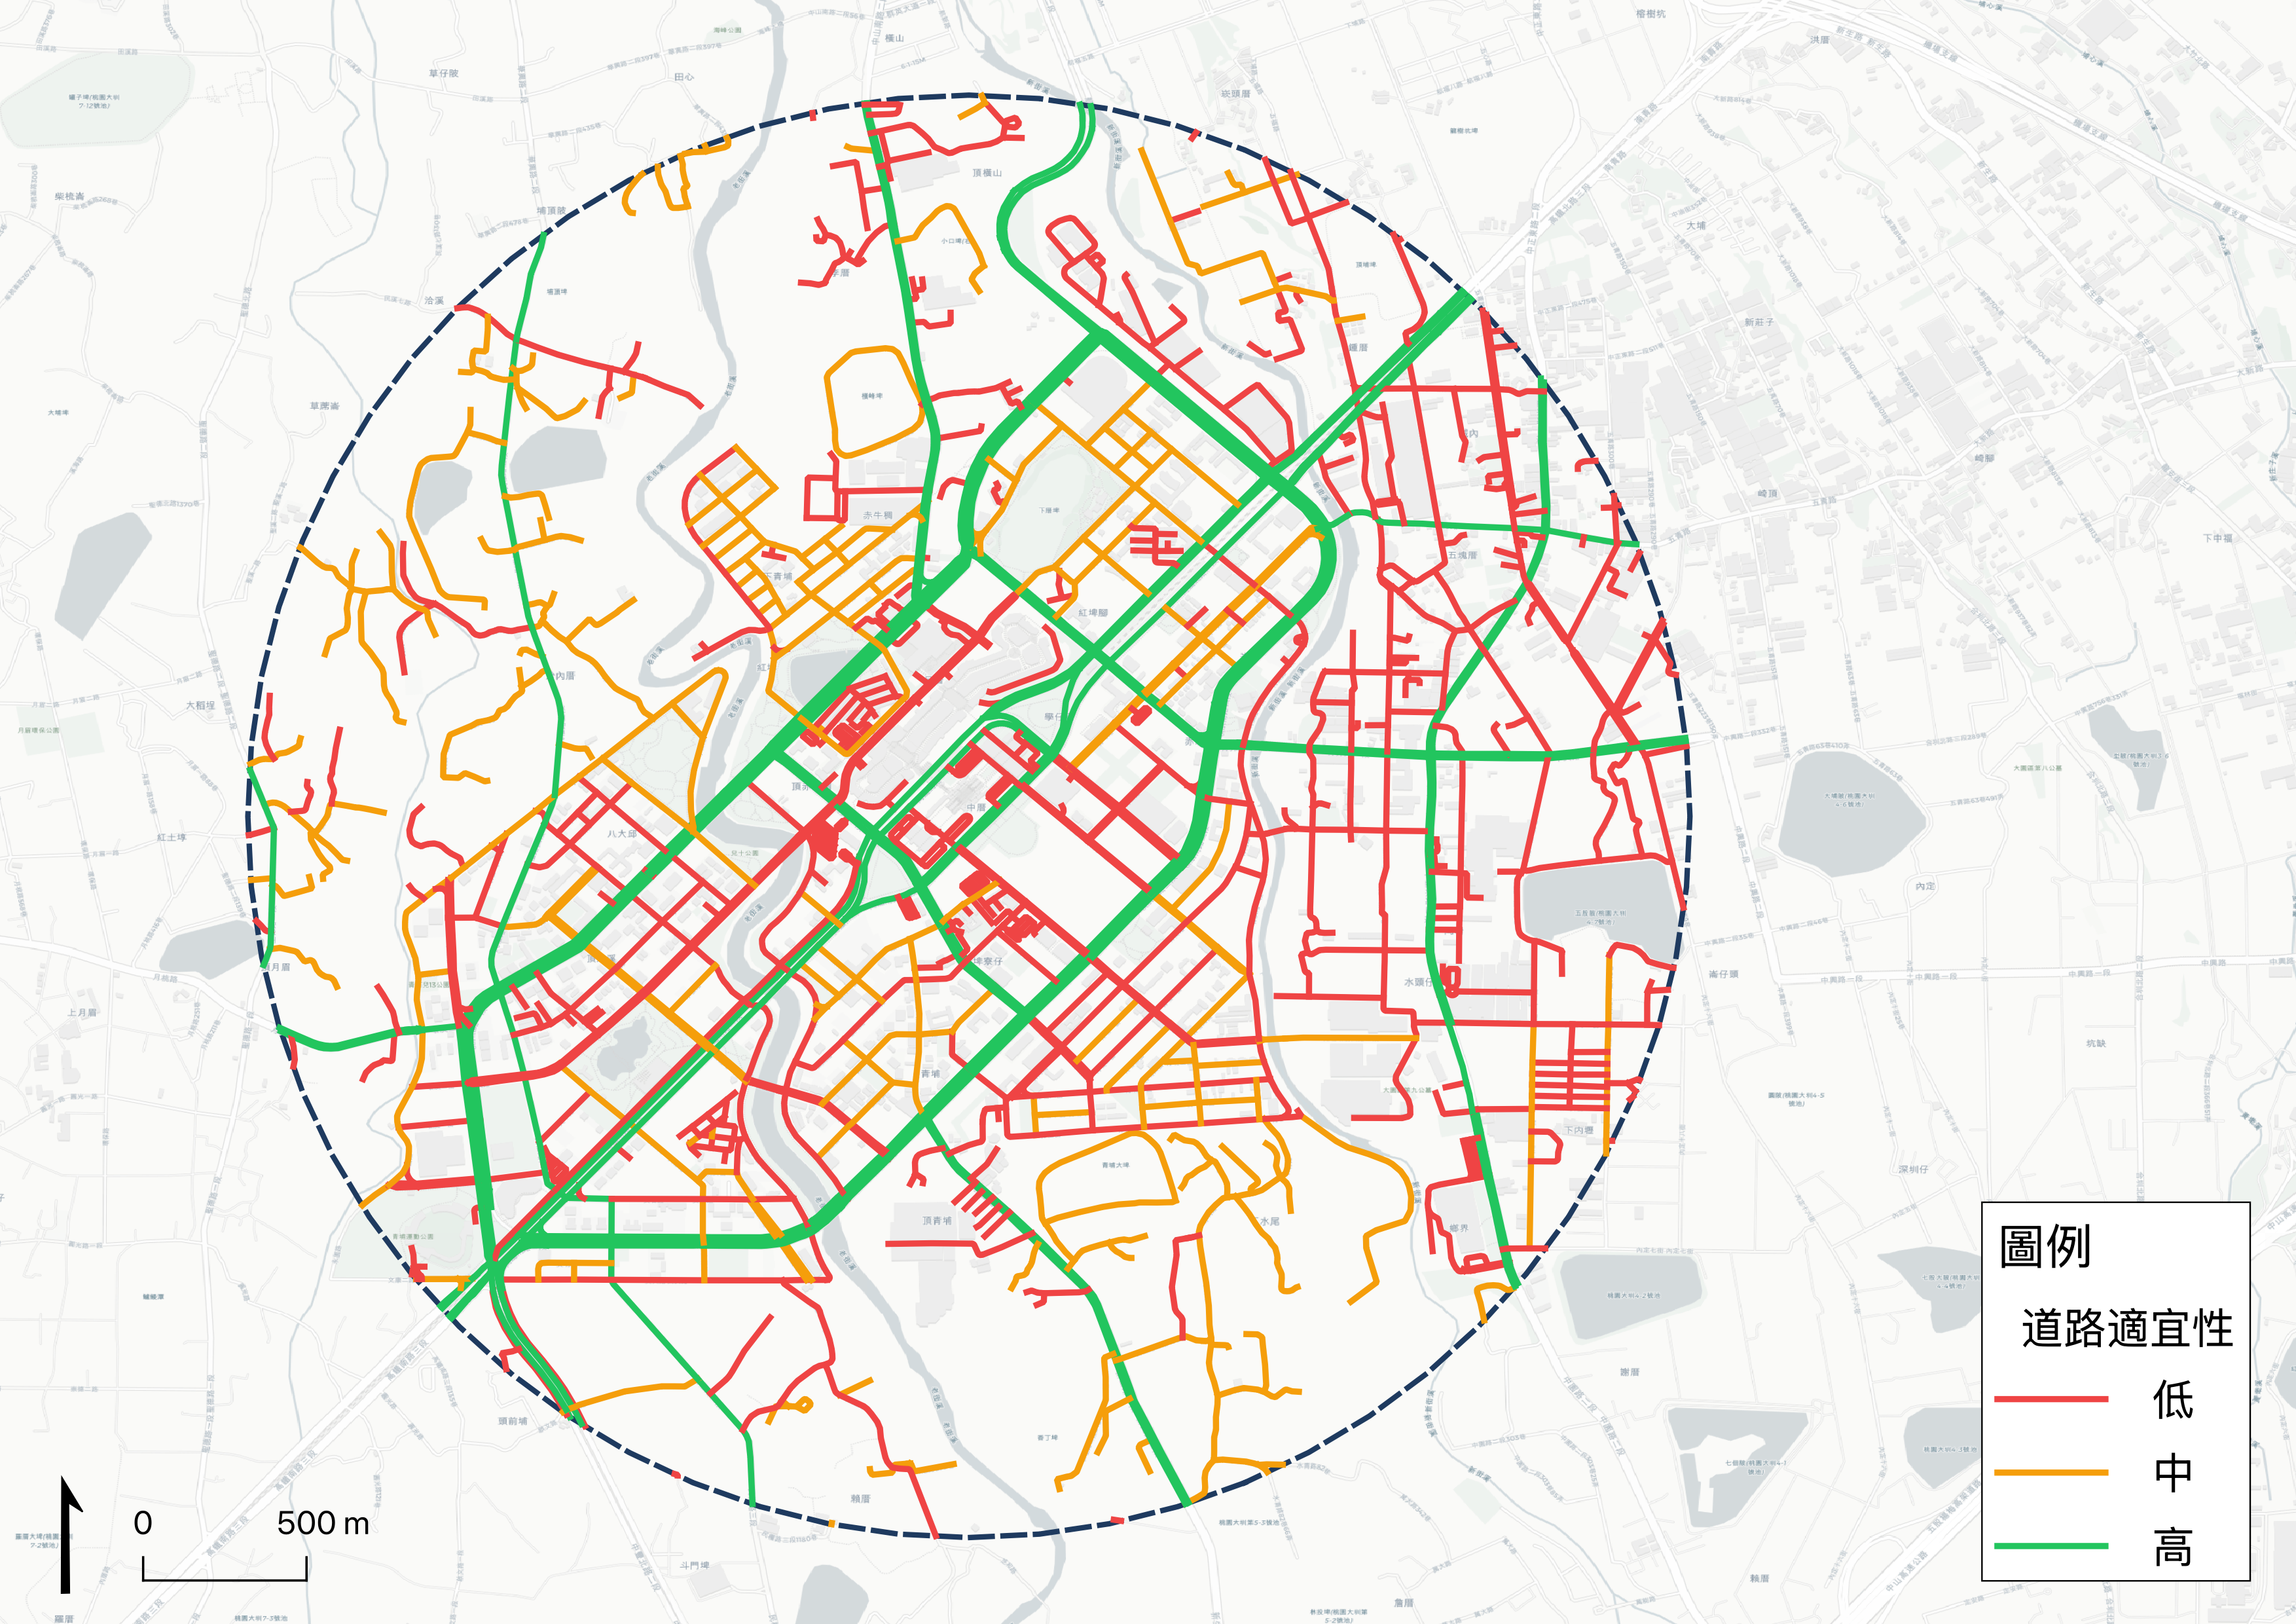
The original study uses a 1–5 road suitability score. Road class, estimated width and speed conditions support corridor screening; a GIS screen still requires field validation before operations.
| Requirement | Threshold recorded in the study | Reference named in the study |
|---|---|---|
| Lane width | ≥ 3.0m | AASHTO Green Book |
| Intersection form | ≤ 4 approaches; signal-controlled | EU INFRAMIX |
| Operating speed | 15–25 km/h | International autonomous-shuttle trials |
| Gradient | ≤ 10% | NACTO Urban Street Design Guide |
| Pavement quality | IRI < 4.0 m/km | FHWA pavement-condition indicators |
| Marking retroreflectivity | ≥ 100 mcd/m²/lux | FHWA MUTCD |
Higher scores favor secondary, tertiary and residential roads, estimated width ≥ 3.0m, and speeds of 15–50 km/h. Segments within 200m of service gaps are preferred for route selection. These screening speeds differ from the proposed operating-speed range above.
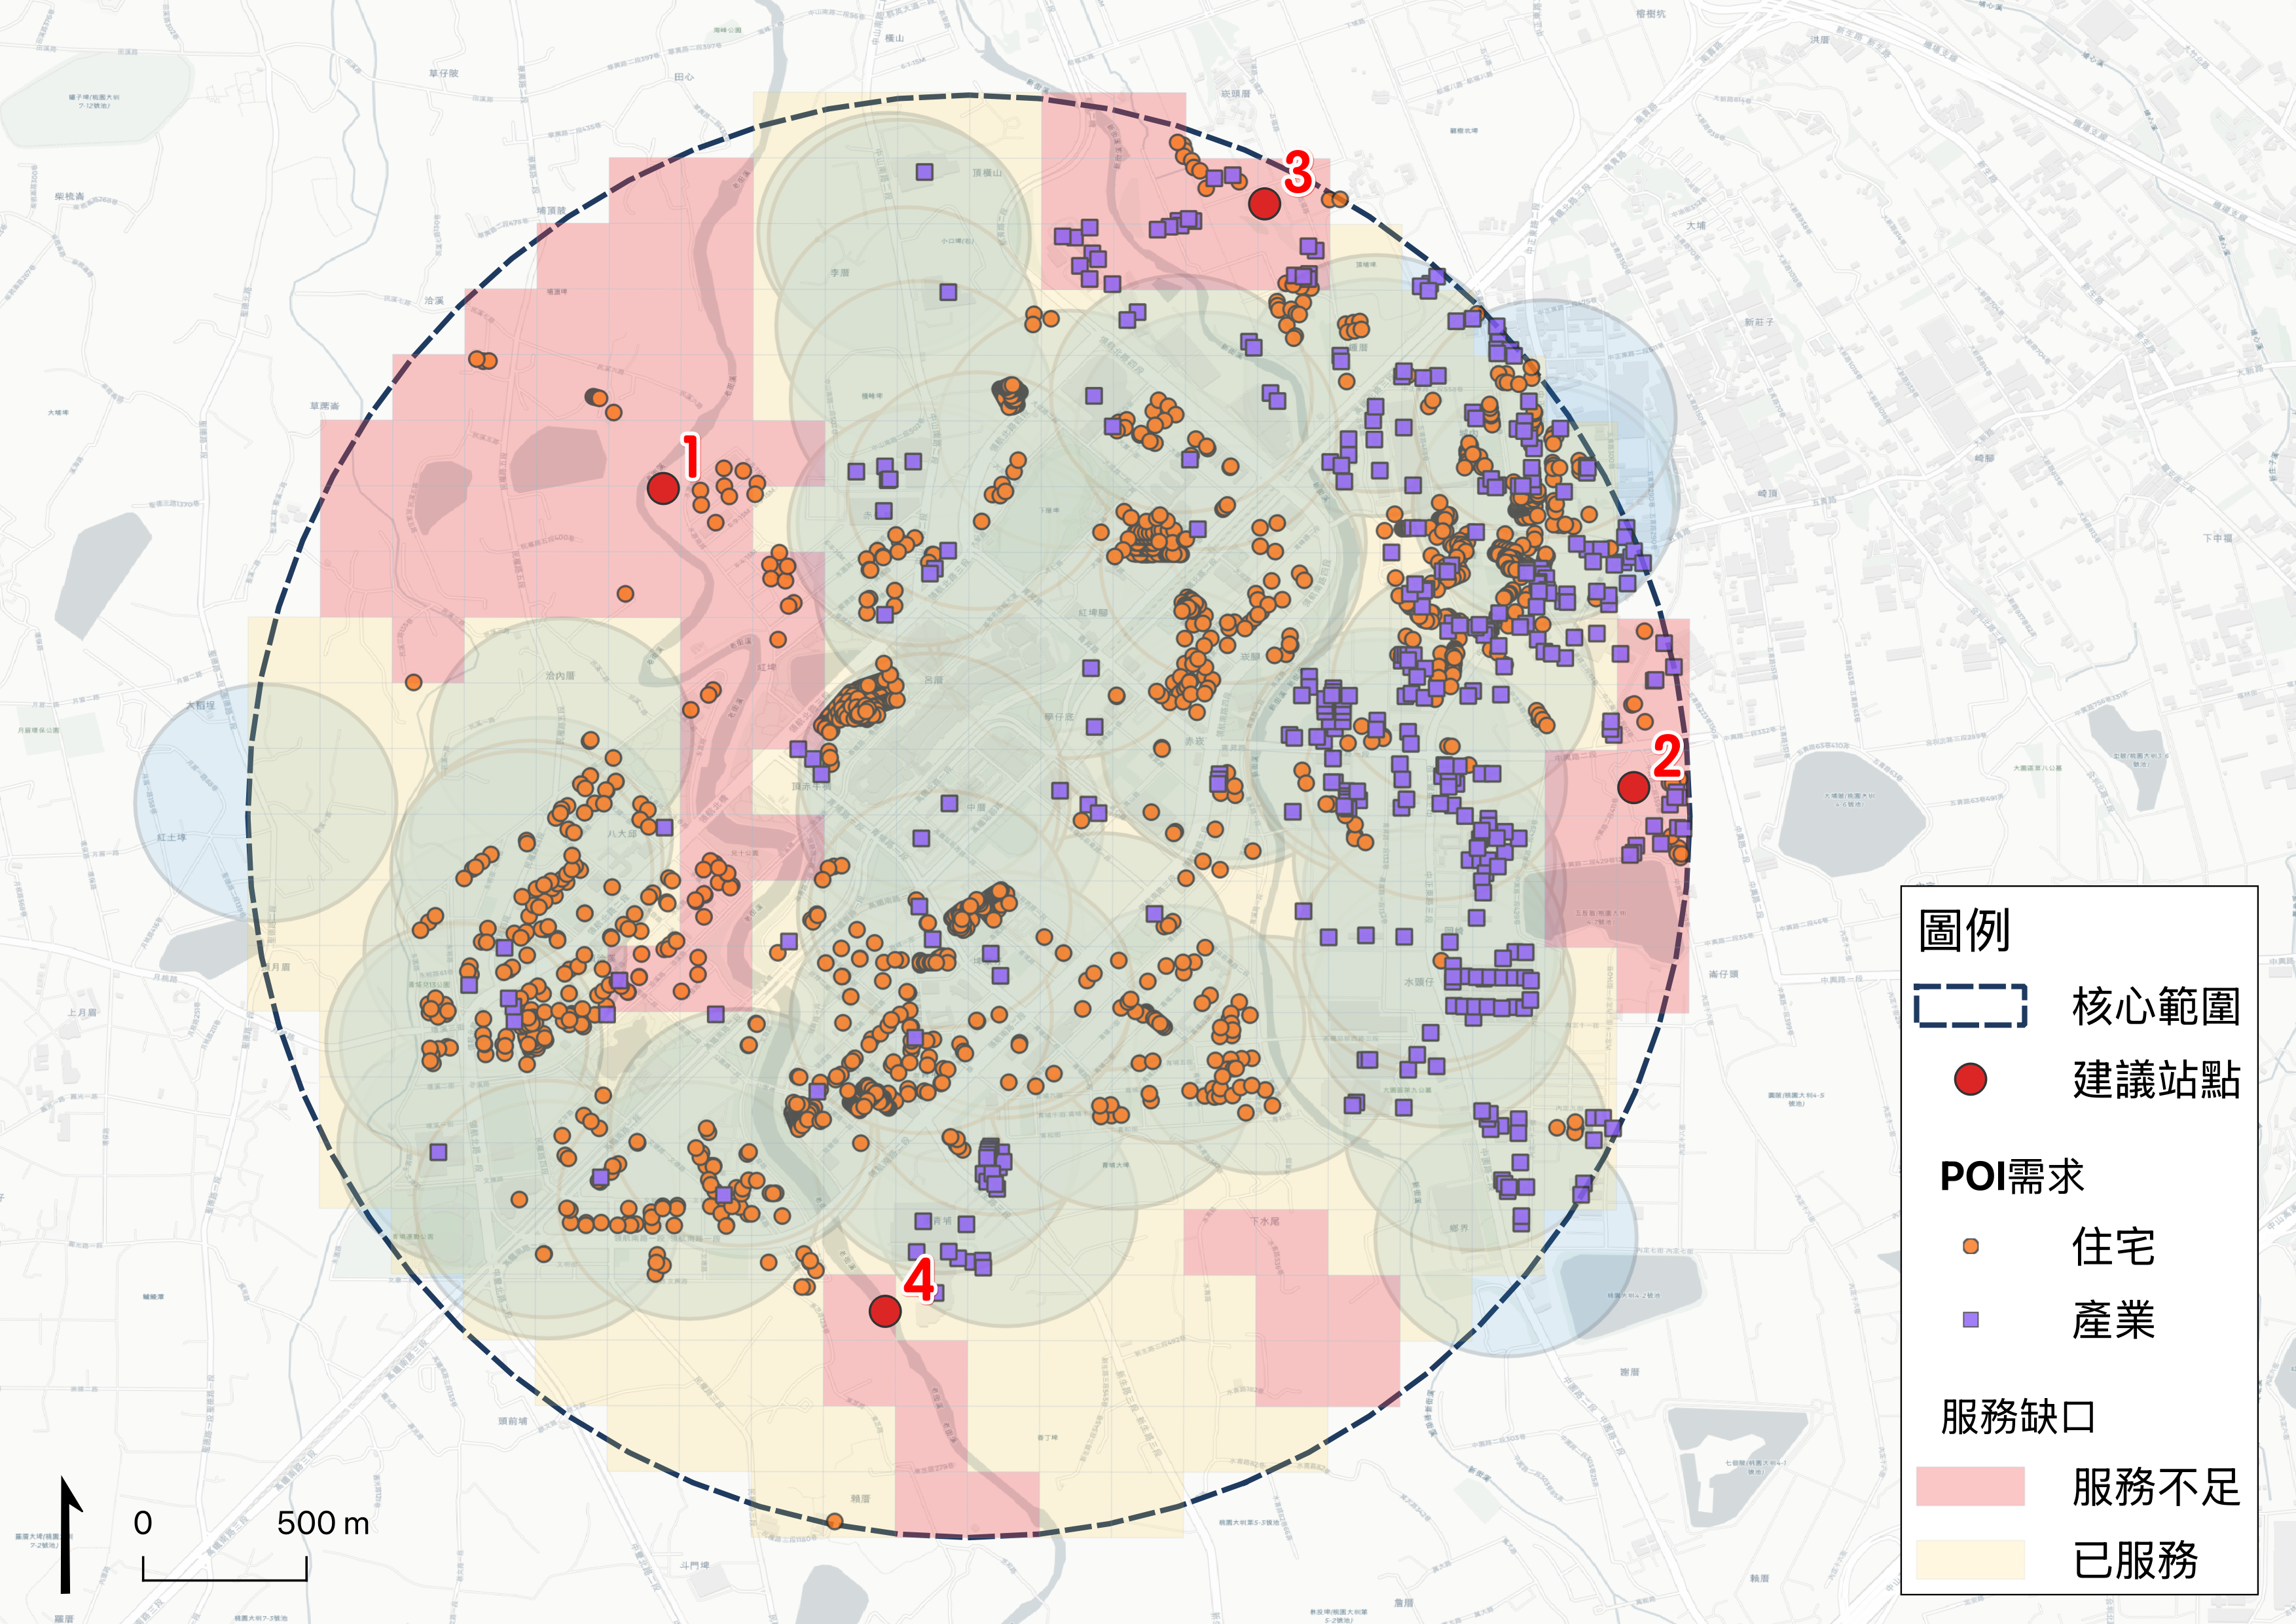
Of 344 grid cells, 76 (22.1%) fall in service gaps, mainly northwest, east and south of the core. Residential and employment POIs confirm demand in four gap clusters. Demand weighting shifts proposed stops toward the local demand centers.
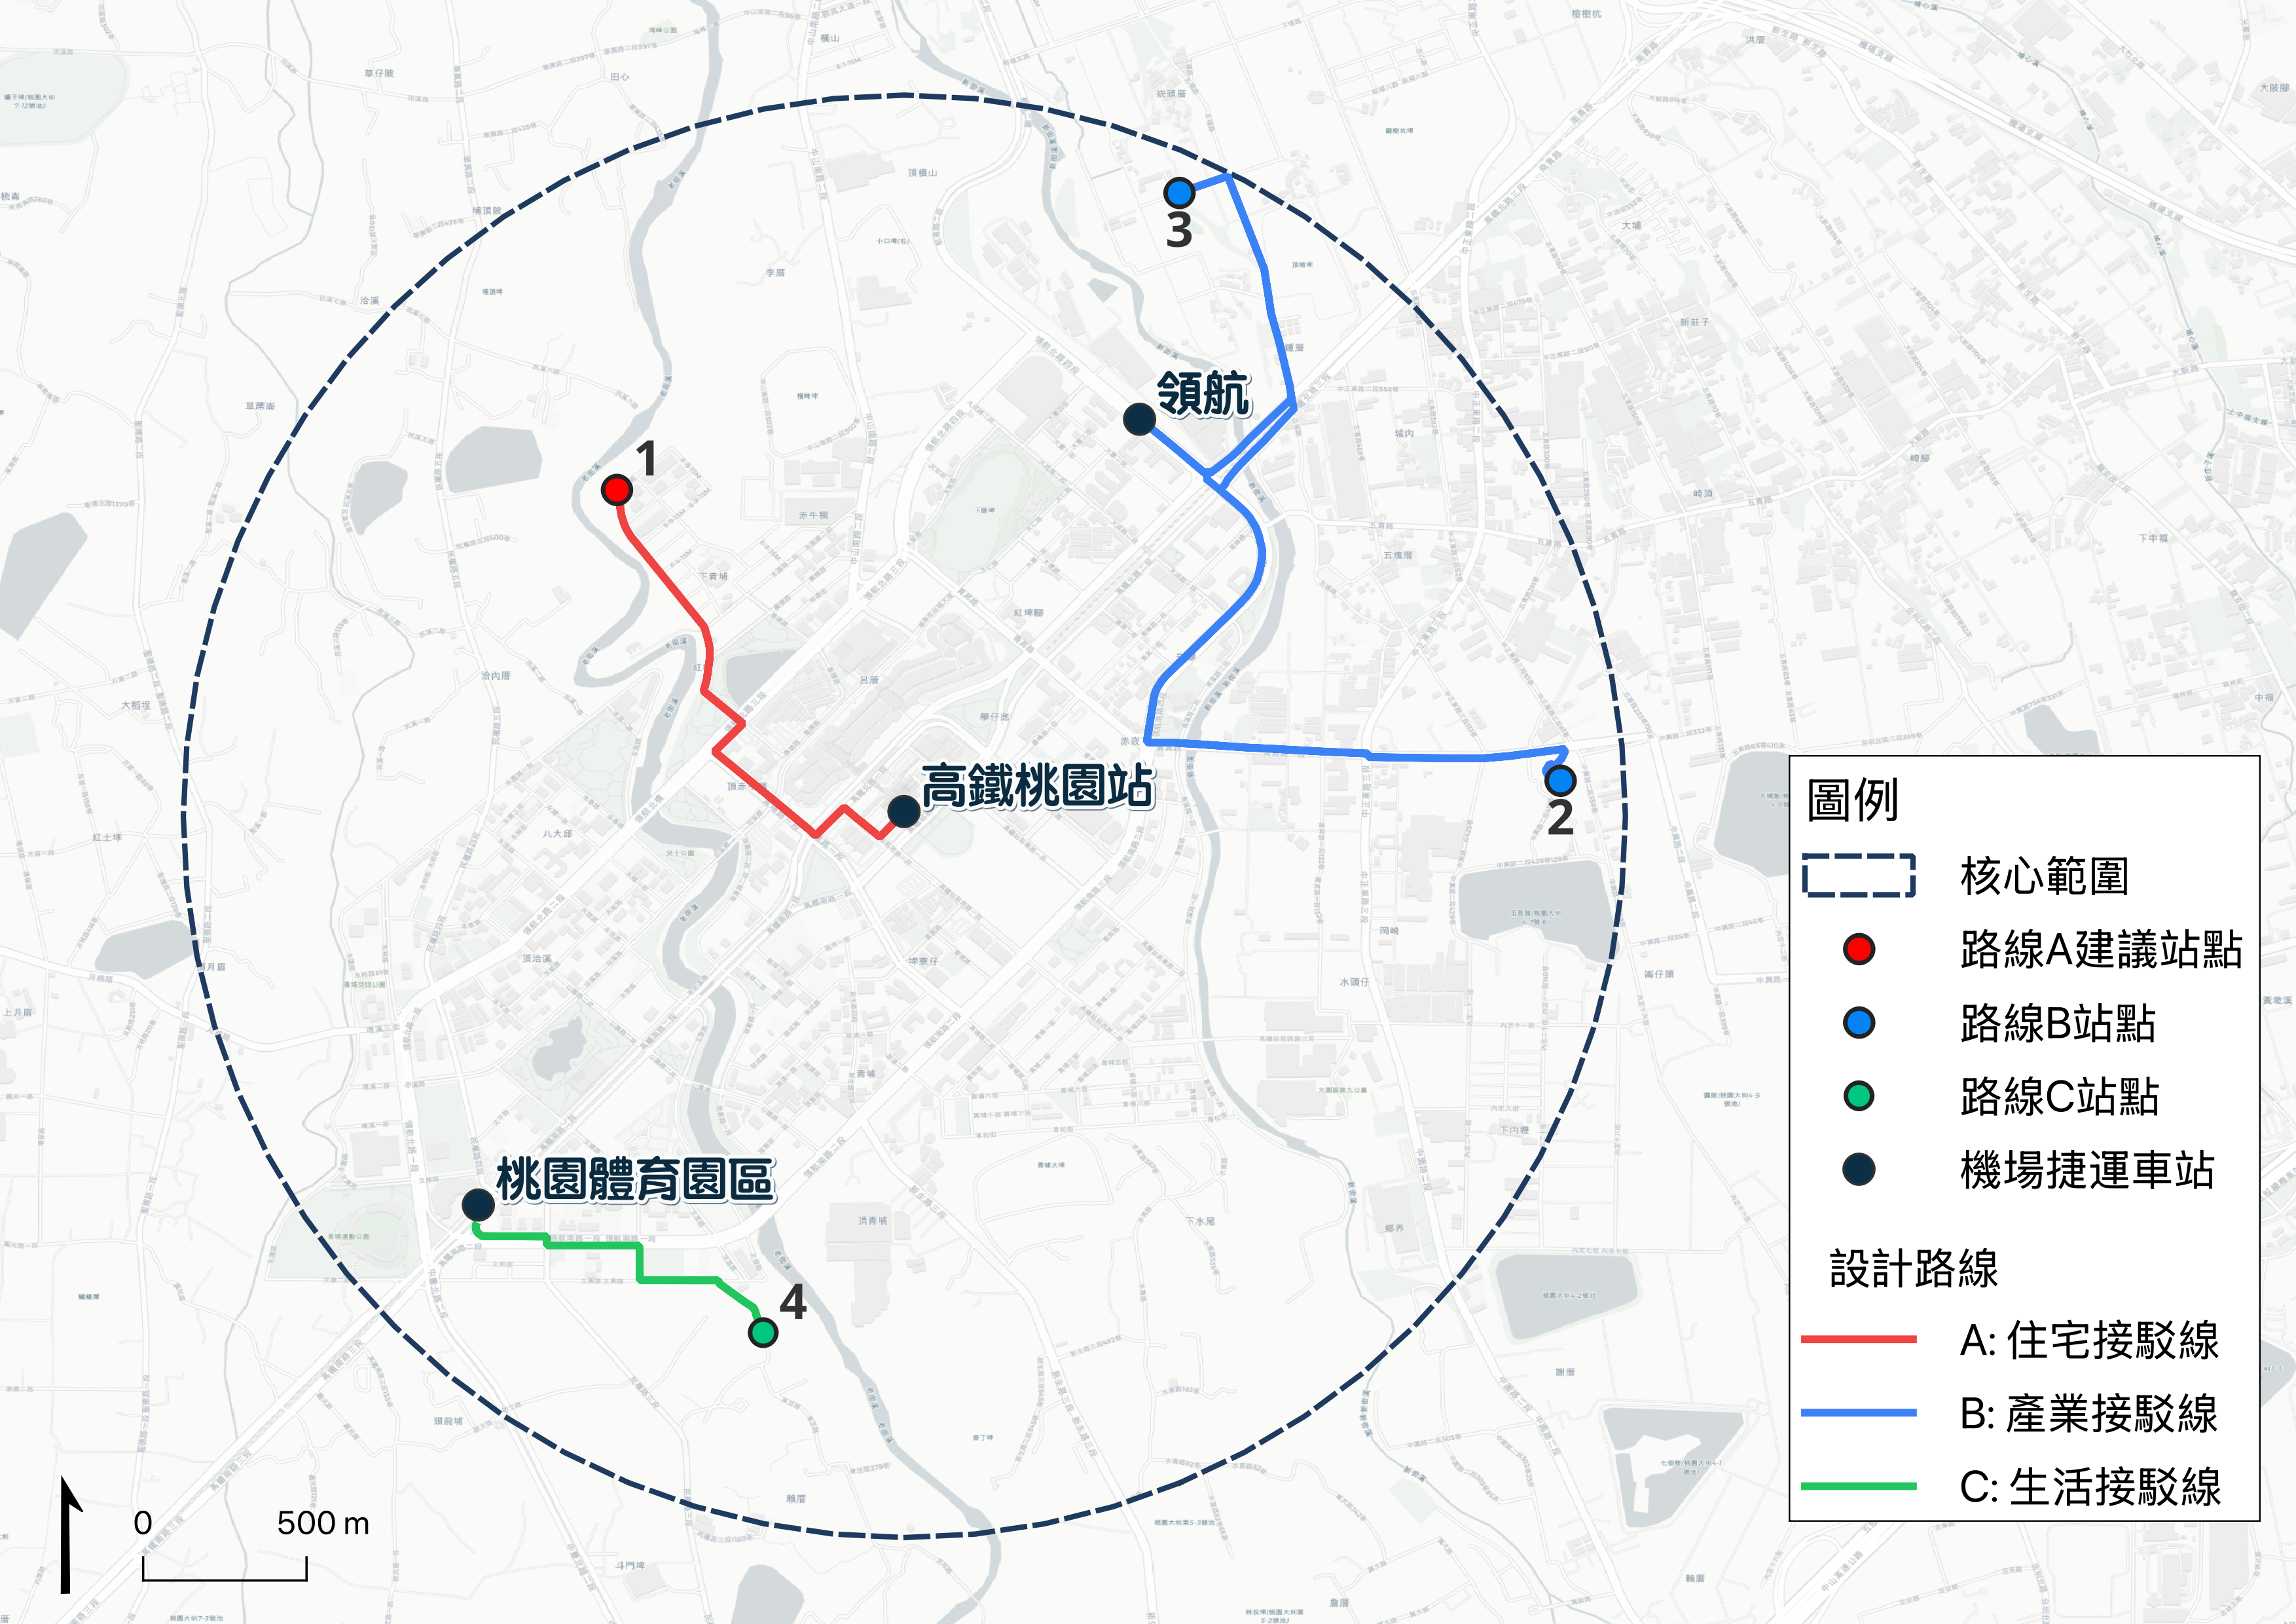
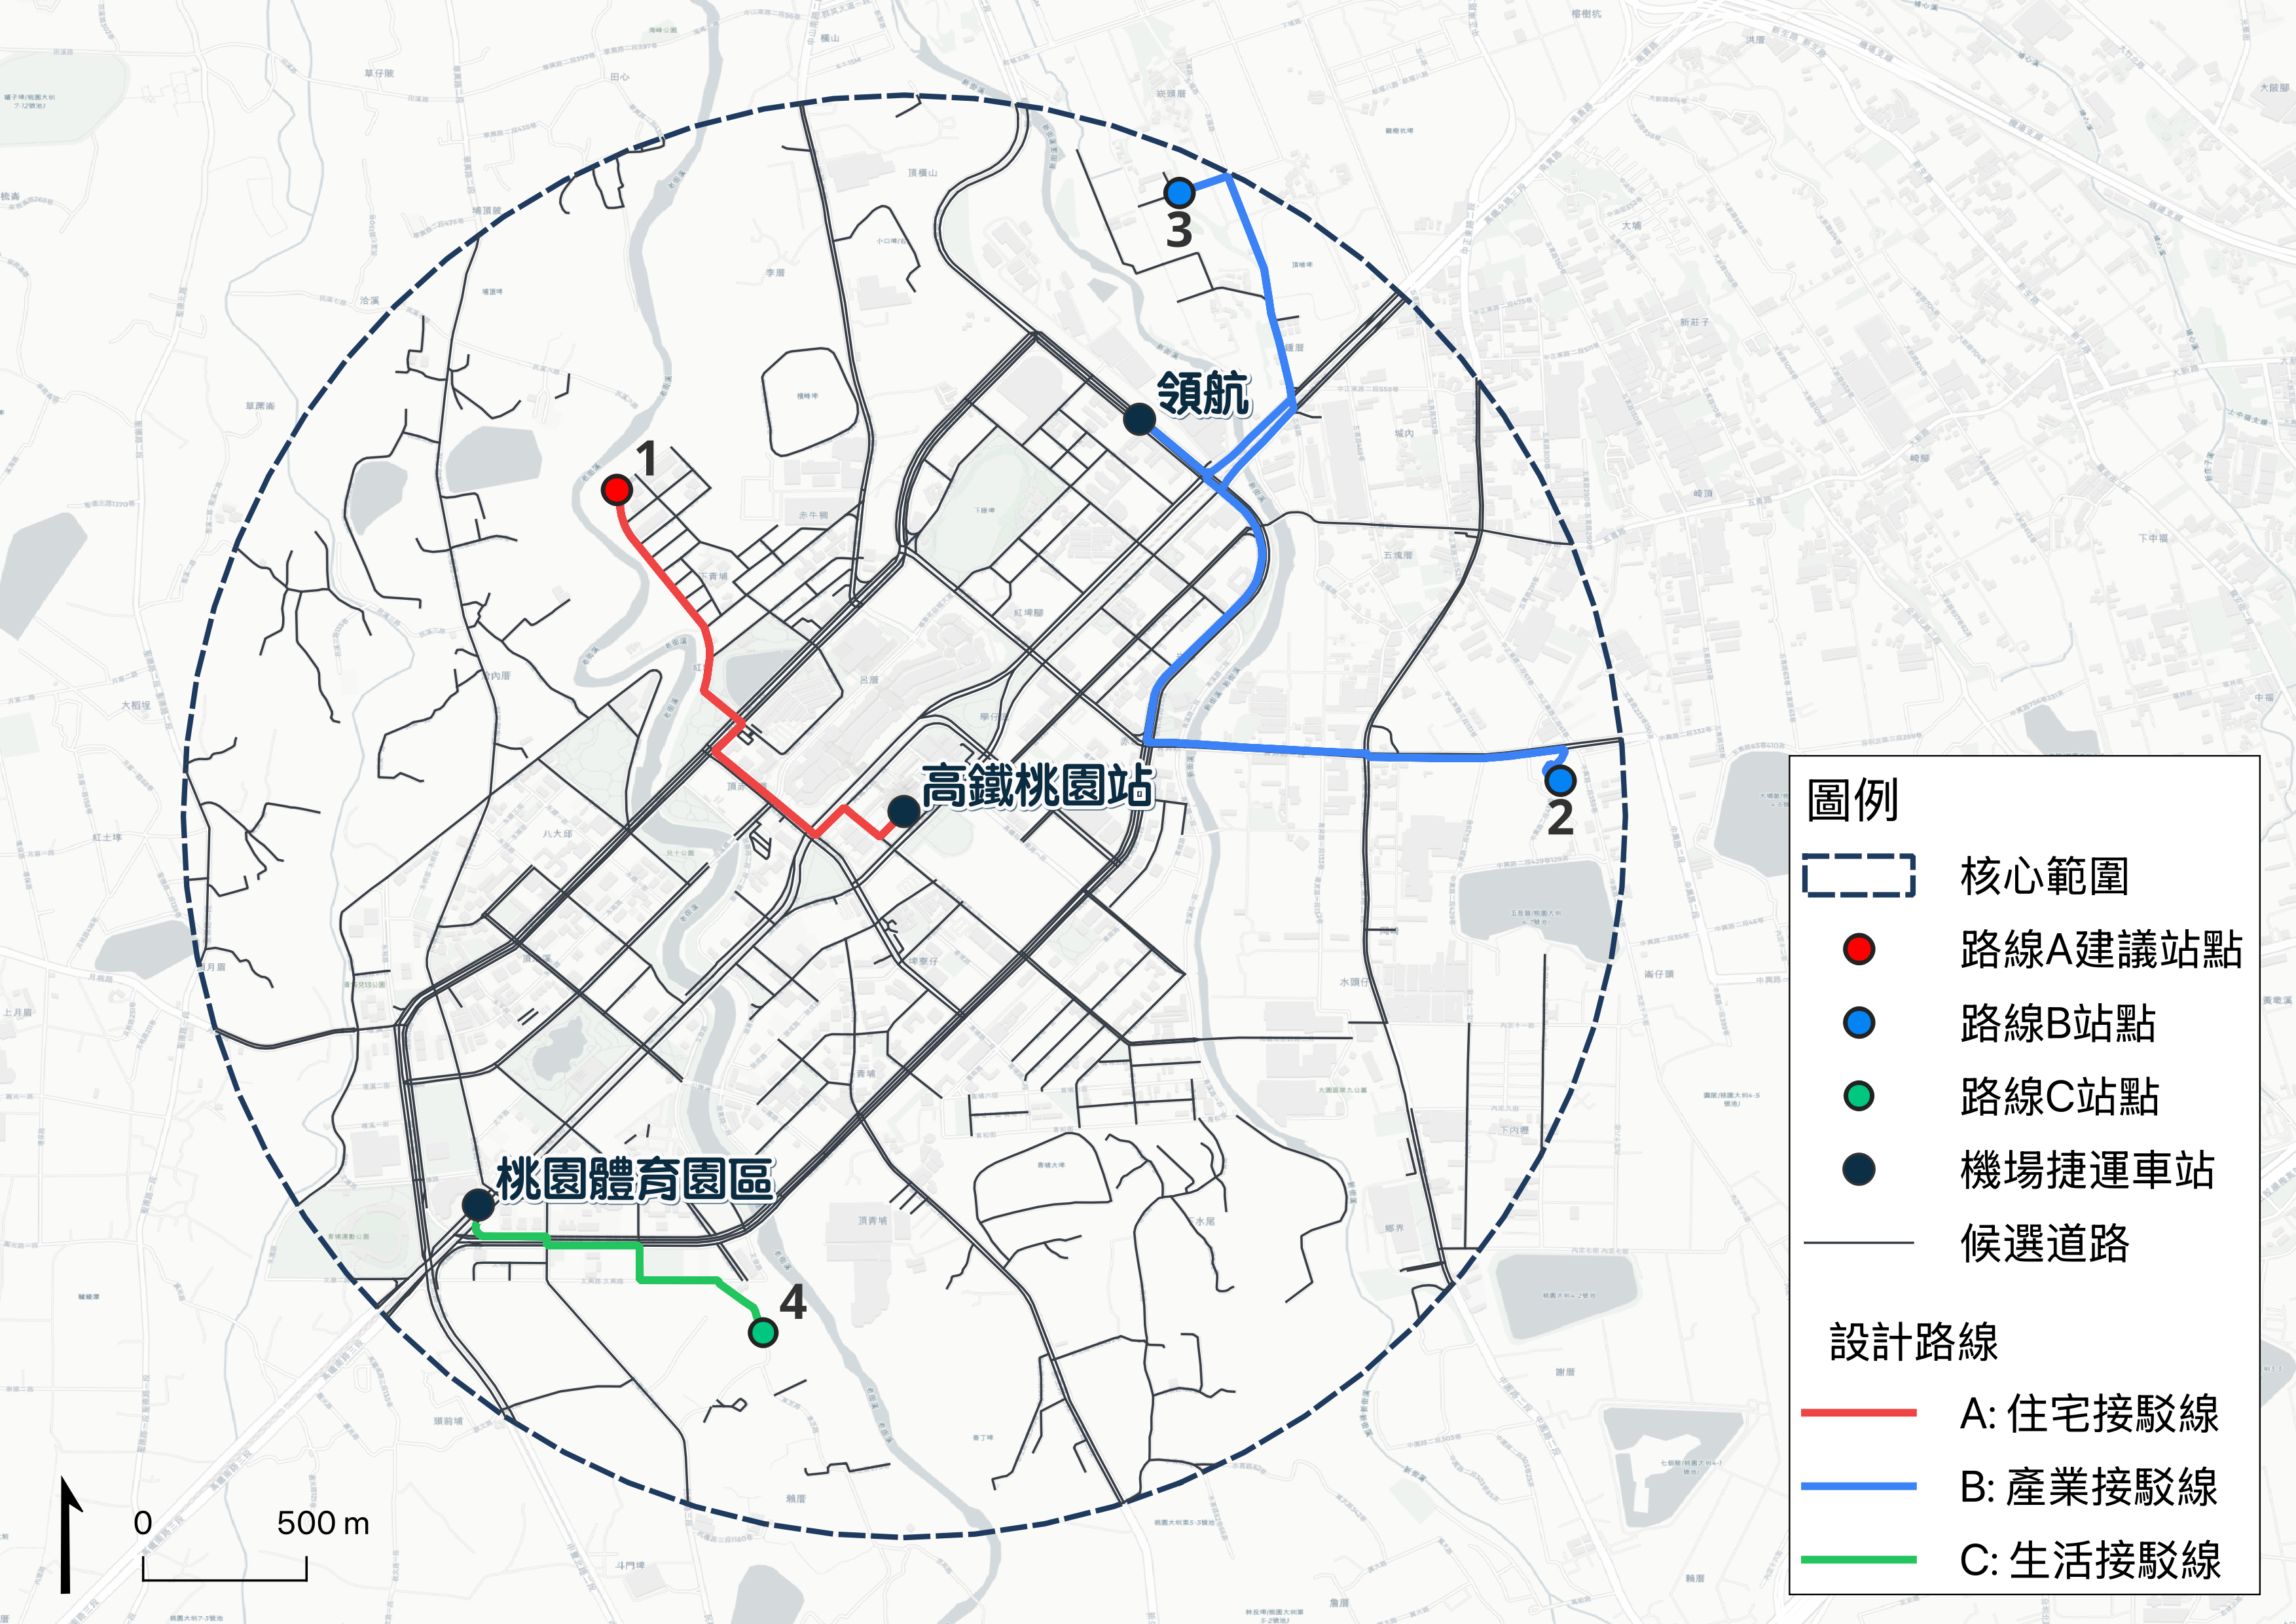
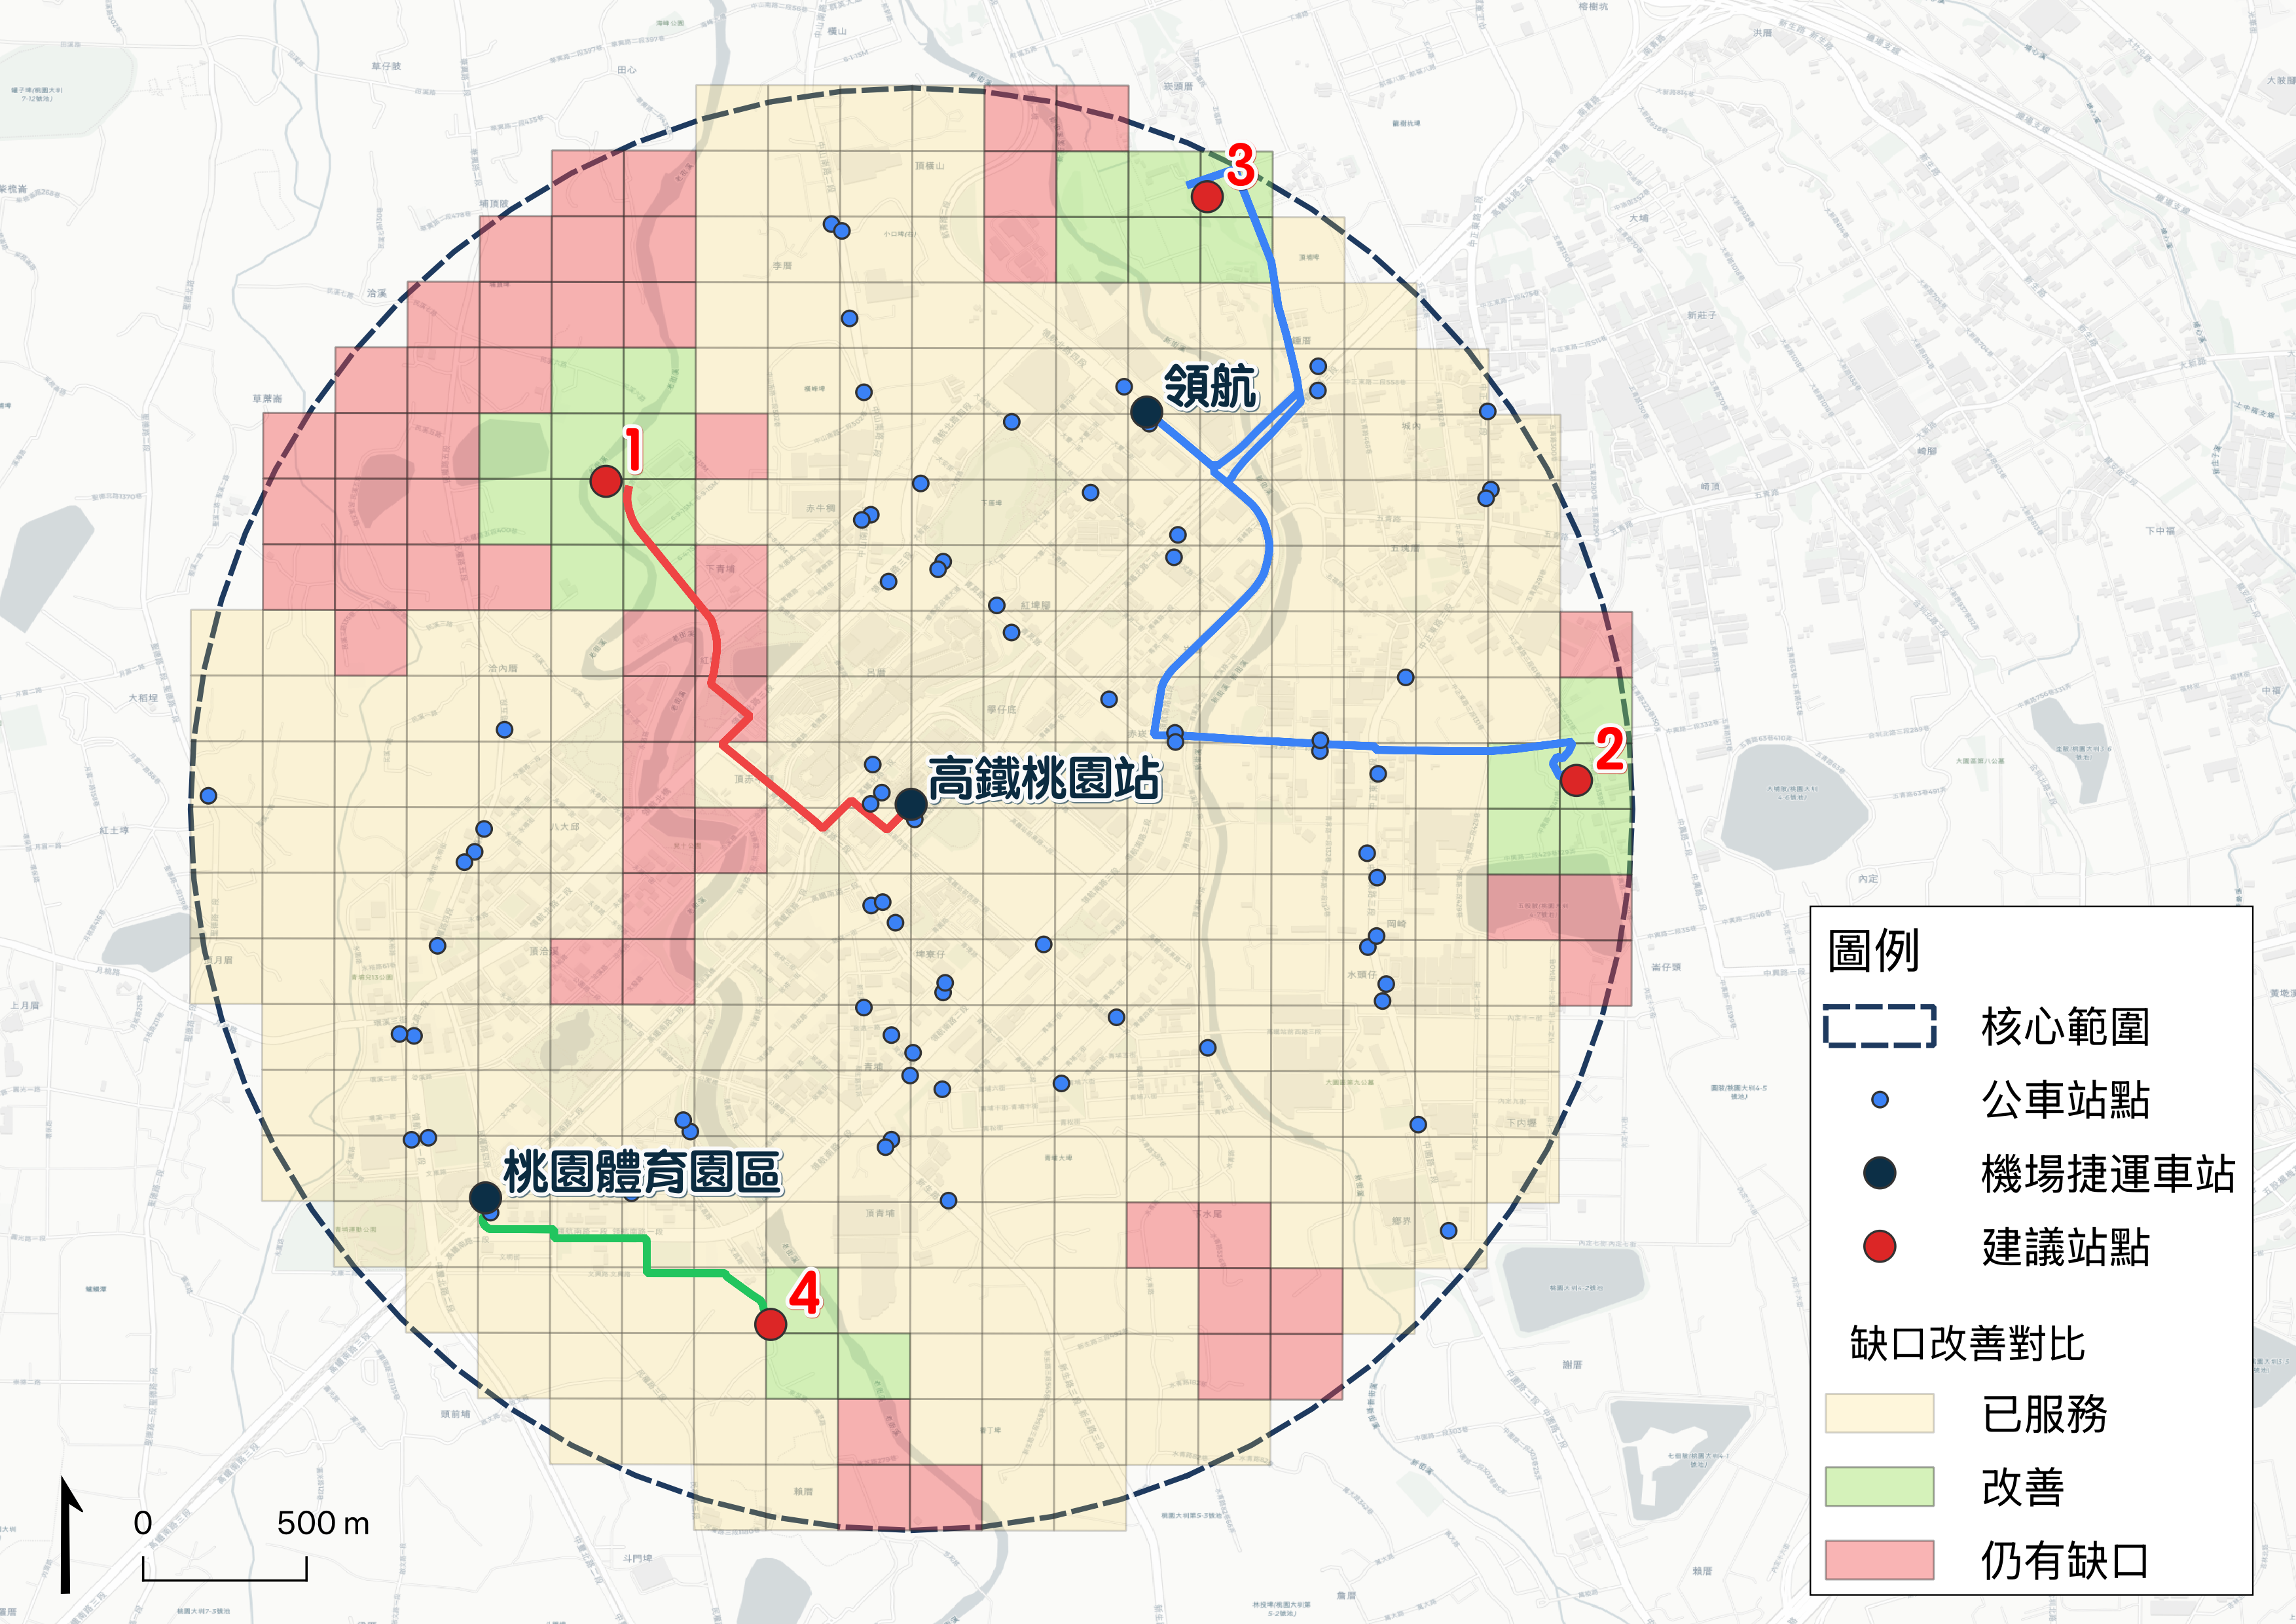
The road assessment covers 1,075 candidate segments. Of these, 233 lie near service gaps and form the candidate set for shuttle corridors. Adding four stops covers 24 previously uncovered cells, a 31.6% reduction in gap cells. The three routes total 12.93km.
3.35km · Taoyuan HSR Station
Connects gap #1 and northwestern residential communities, including Baolai Garden and Prague Spring, for homebound HSR commuters. Proposed phase 1.
7.49km · Linghang Station
Connects gaps #3 and #2 with the eastern industrial area, including the Dajiang Industrial Park and 3M logistics center, and northern housing. Proposed phase 2.
2.09km · Taoyuan Sports Park Station
Connects gap #4 with emerging southern communities and Qingtang Park. A compact route for lower-demand daily and recreational trips. Proposed phase 3.
The original report proposes route A first because it serves the HSR hub. It calls A the shortest route, but its own distances show C is shorter (2.09km versus 3.35km). This discrepancy is retained as a source limitation; phase priority is presented as the original proposal, not as a conclusion from route length alone.
The report snapshot contains 1,802 POIs: 1,418 residential and 384 employment features. Stop placement combines 70% demand centroid with 30% gap geometry centroid, moving stops toward demand rather than relying solely on geometric centers. OpenStreetMap completeness limits the estimates; actual demand may be higher.
| Proposed stop | POIs within 800m | Shift from gap center | Route |
|---|---|---|---|
| #1 | 32 | 237m | A |
| #2 | 184 | 231m | B |
| #3 | 172 | 130m | B |
| #4 | 38 | 339m | C |
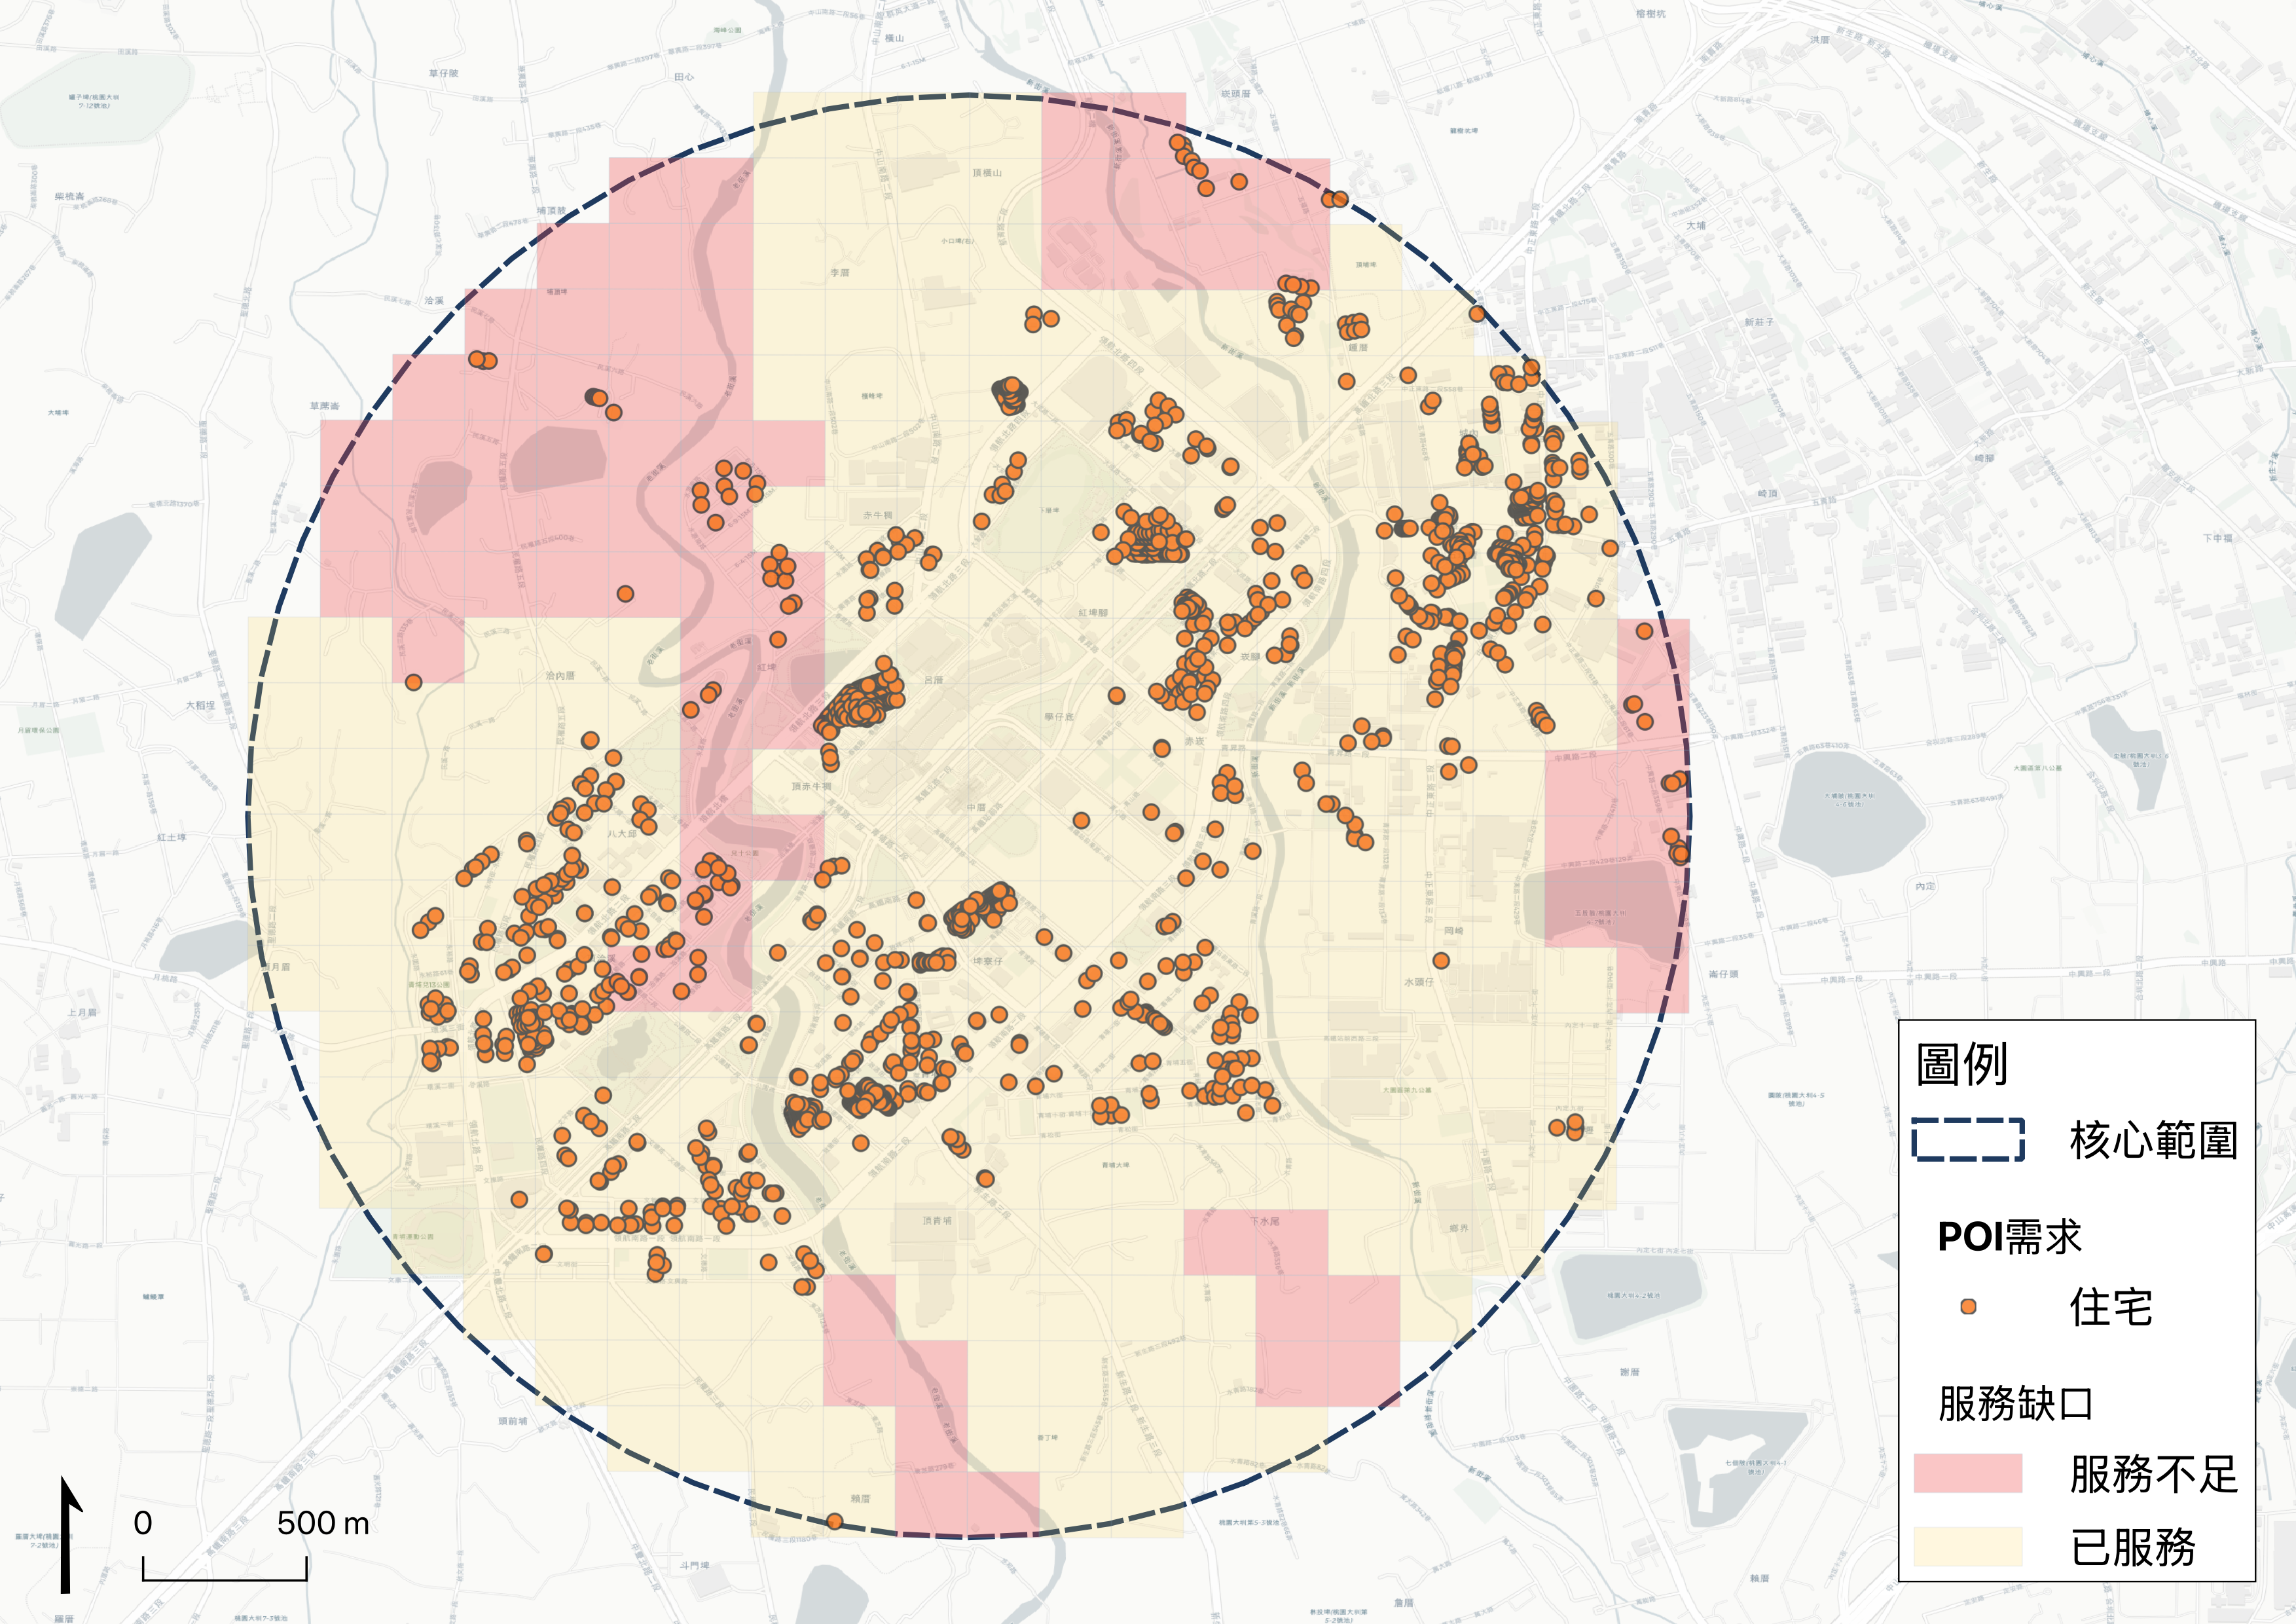
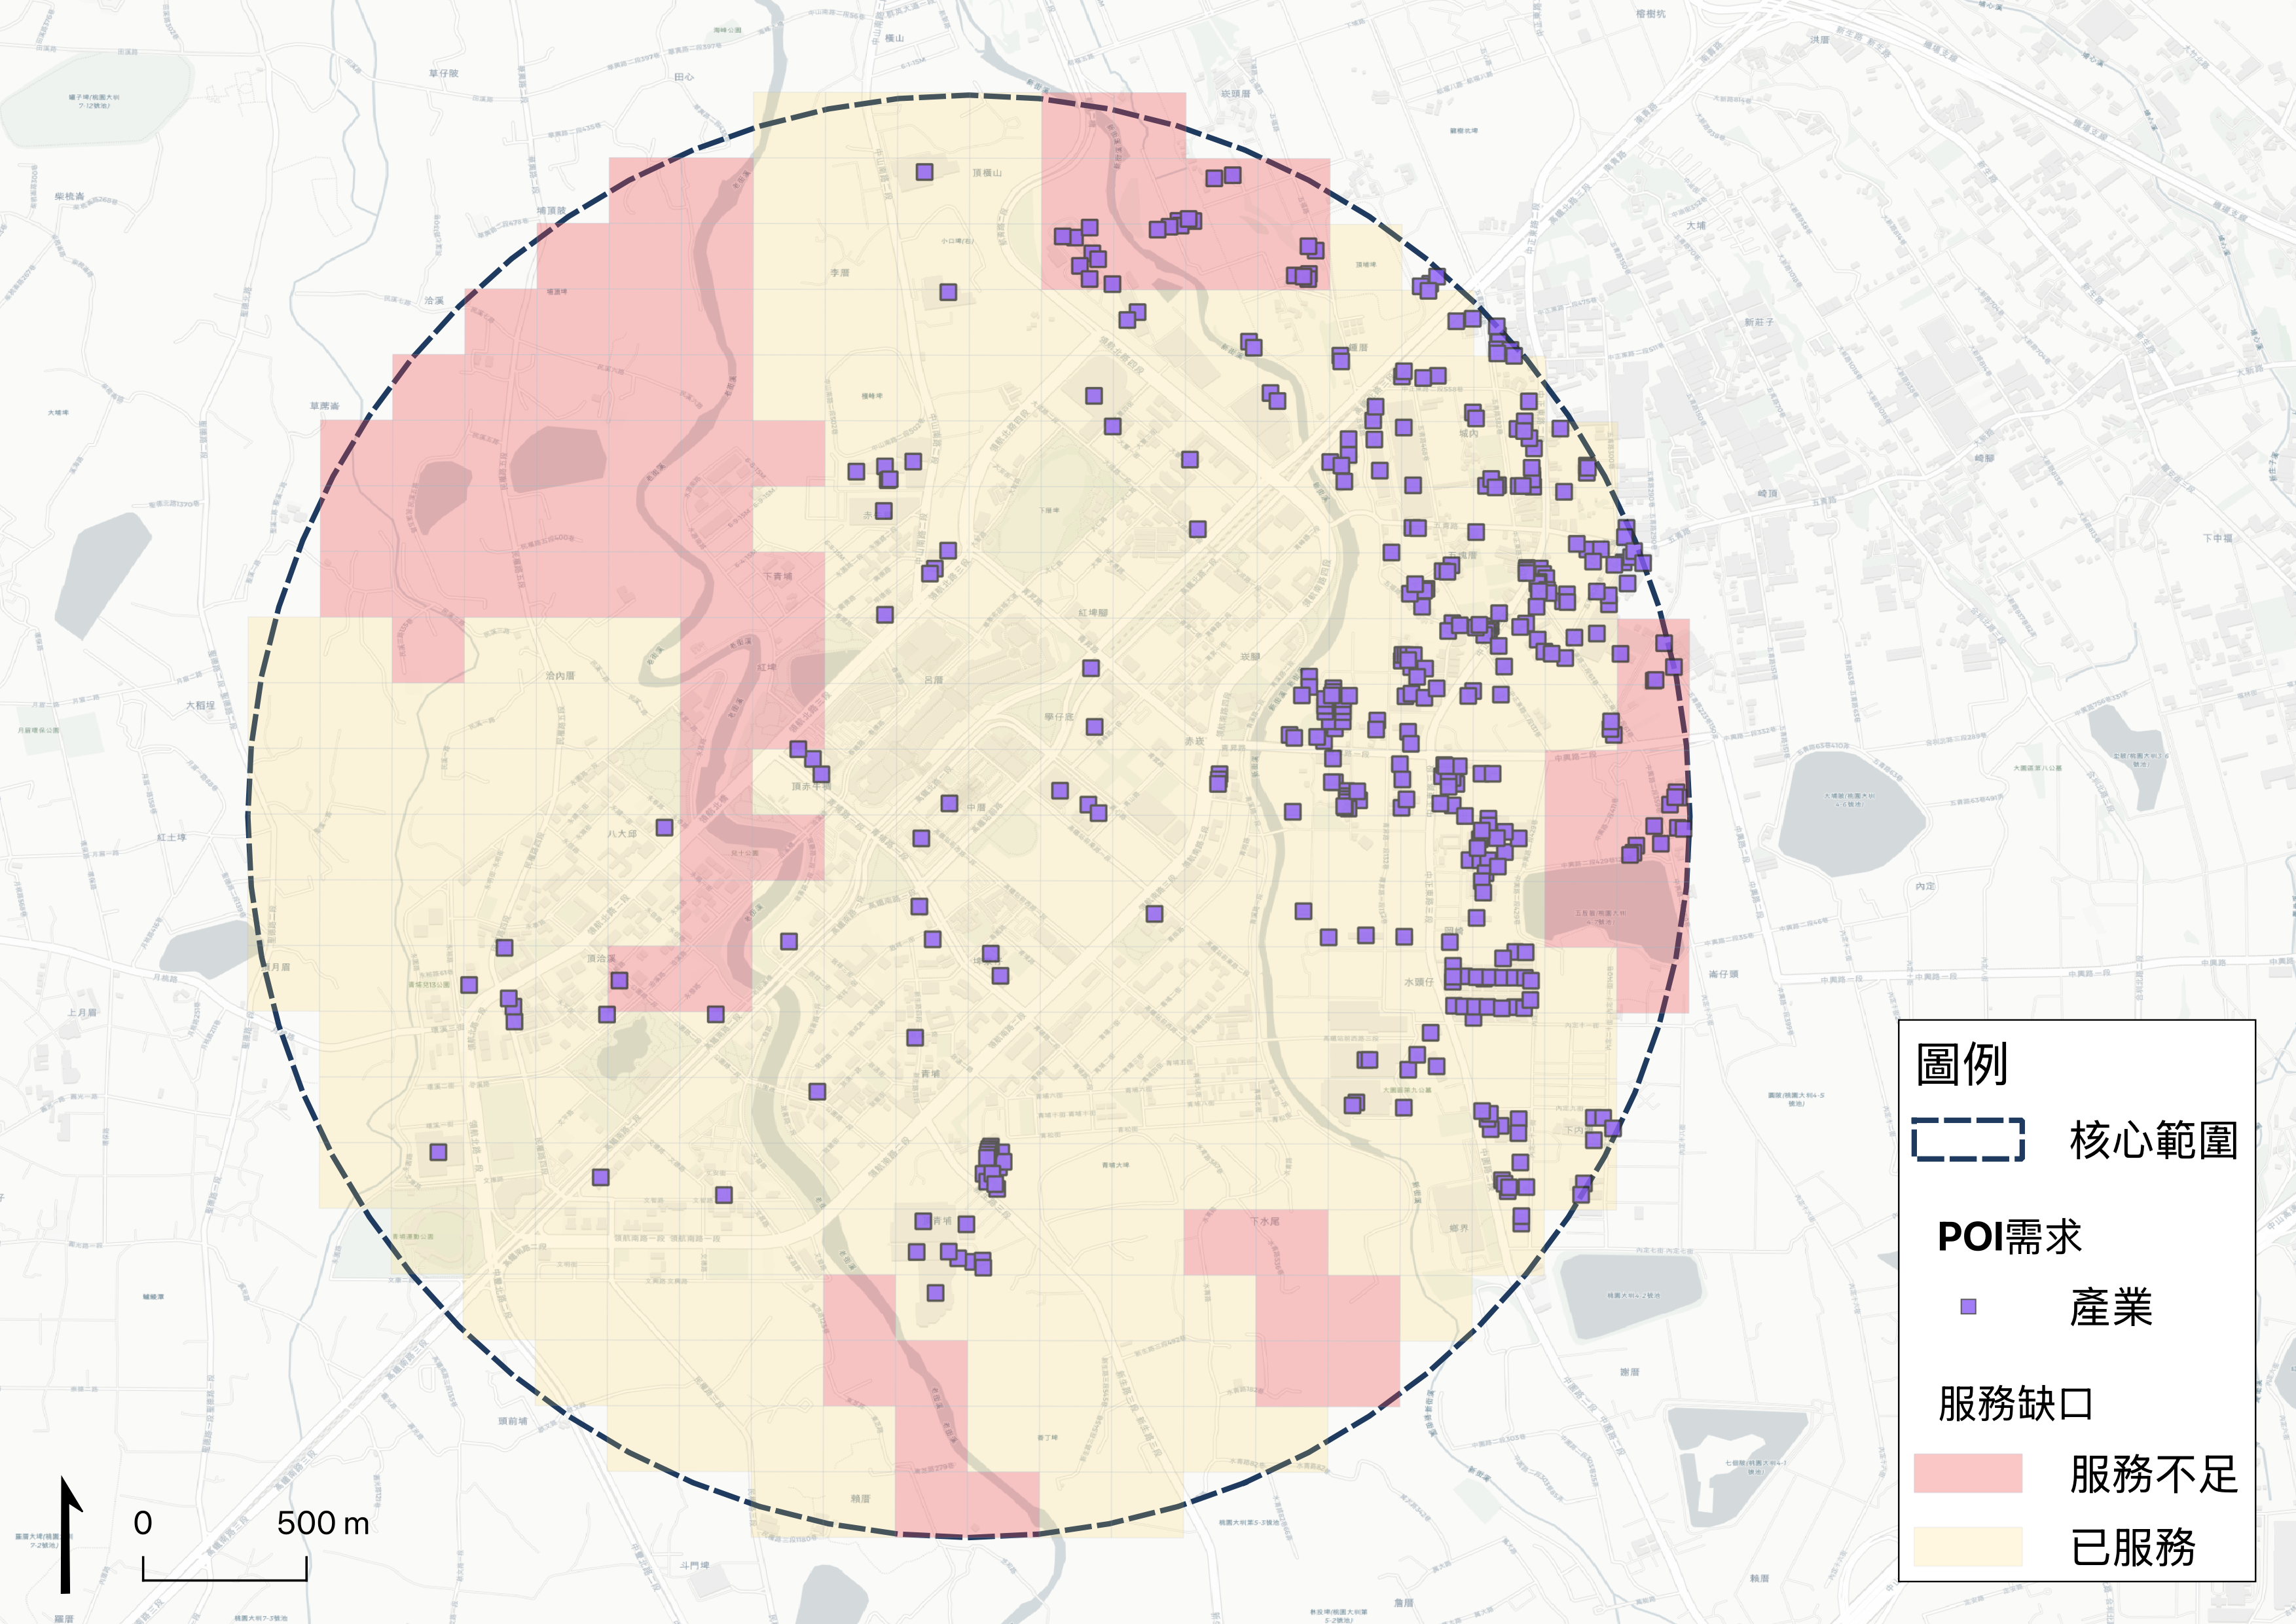
Click the map to activate dragging and zooming. Use the layer control to inspect bus stops, service buffers, gap cells, road suitability, demand POIs and the proposed routes. Hover over roads or cells and click stops to inspect attributes.
The map's POI layer labels list 1,934 residential and 725 employment features, while the report uses 1,418 and 384 in the core study area. Their original extraction extents and versions have not been reconciled. The map's core outline is a 2km road-network reach area; the report describes a 2km circular area. Route popups retain mean ODD scores of 5.6, 6.8 and 6.2, which cannot be interpreted on the report's stated 1–5 scale without reviewing the original scoring code. Route C's popup lists gaps #5 and #4 while the report lists #4. All source geometries and numerical attributes are preserved; these discrepancies have not been silently corrected.
Dataset place names use Mandarin romanization where no English name was recorded. These transliterations are display aids and do not claim to be official English names. The basemap retains its provider attribution.
Moving from GIS results to a pilot requires field checks, agency coordination and staged validation. Proposed work includes on-site verification, HD map and LiDAR surveying, right-of-way coordination, regulatory applications, route A trial operations and KPI collection, followed by routes B and C if operating evidence supports expansion.
| Stakeholder identified in the original study | Proposed role |
|---|---|
| Taoyuan Department of Transportation | Road-use approval and bus-network integration |
| Ministry of Economic Affairs unmanned-vehicle office | Experimental-program application coordination |
| Dayuan District Office and village offices | Resident engagement and local coordination |
| Autonomous vehicle vendors | HD mapping and vehicle deployment |
| HSR agencies and Taoyuan Metro | Station transfer arrangements |
| Nearby retail destinations, including Gloria Outlets and IKEA | Waiting areas and trip generation |
The proposed coverage target is a reduction in the gap share from 22.1% to 15.1%. The implementation sequence remains a planning proposal, with no claim that a pilot has been operated.
The original analysis names the following references. They document the study's historical basis; this English edition does not claim to have downloaded updated datasets or revalidated current regulations.
Tools recorded in the study: Python, GeoPandas, QGIS and Folium, with ODD screening and demand-weighted stop placement.